Experimental Investigation on the Ranging Resolution of a FMCW Lidar


1
School of Physical Science and Technology, Southwest University, Chongqing 400715, China
2
Chongqing Key Laboratory of Micro & Nano Structure Optoelectronics, Southwest University, Chongqing 400715, China
3
School of Mathematics and Physics, Jingchu University of Technology, Jingmen 448000, China
*
Author to whom correspondence should be addressed.
Photonics 2022, 9(1), 11; https://doi.org/10.3390/photonics9010011
Submission received: 27 November 2021
/
Revised: 22 December 2021
/
Accepted: 24 December 2021
/
Published: 28 December 2021
(This article belongs to the Special Issue Microwave Photonics Applications)
Abstract
:In some previous reports about frequency-modulated continuous-wave (FMCW) Lidar, observing the longer waveform of a de-chirped signal is considered an effective scheme for further improving the ranging resolution. In this work, the ranging resolution of a FMCW Lidar is experimentally investigated, and the feasibility of such a scheme is tested. During the experiment, a FMCW signal is generated via a Mach–Zehnder modulator in the transmitted port. In the received port, the de-chirped signal is extracted based on a homodyne detection scheme and is analyzed by an electrical spectrum analyzer. Two different methods are adopted to determine the ranging resolution. One is based on a single target, for which the ranging resolution is obtained through inspecting the shift of spectral peak position as the target moves. The other is based on two targets, for which the ranging resolution is acquired through inspecting the variation of spectrum distribution as the spacing of two targets changes. The experimental results demonstrate that extending the observed duration of the de-chirped signal cannot improve the ranging resolution, and the corresponding physical mechanism is revealed.
1. Introduction
Compared with short-pulsed Lidar based on cross-correlated time-of-flight (ToF) detection, frequency-modulated continuous-wave (FMCW), Lidar utilizing coherence detection mechanism could provide a larger dynamic range at low average power and more outstanding resolution [1]. Moreover, FMCW Lidar can be utilized to simultaneously measure the distance and the velocity of a target without increasing the cost and systematic complexity. Therefore, FMCW Lidars have been widely applied in various fields such as atmospheric measurements, object tracking and location, 3D imaging, automotive collision avoidance, free-space optical downlink communications, bio-medical application, etc. [2,3,4,5,6,7].
So far, various elaborately-designed FMCW Lidars have been proposed [8,9,10,11,12,13,14,15,16,17,18,19,20]. In order to achieve high-accuracy measurement, a FMCW signal with excellent linearity is required as the emitted source of the Lidar. Based on the variation of the lasing frequency of a semiconductor laser (SL) with its current, a FWCM signal can be generated by a SL under current-modulation with a swept signal [8]. Although such a generated technique is relatively simple, the linearity of the generated FMCW signal is relatively poor due to the nonlinear response of SL. In order to compensate for the nonlinearity, some schemes are proposed through introducing pre-distortion or adopting dual-path systems [9,10]. Excepting direct-current modulation, external modulation is another scheme for generating FMCW signal [11,12,13,14,15,16], for which a modulator, such as an in-phase/quadrature (I/Q) modulator or a Mach–Zehnder modulator (MZM), is utilized to modulate a continuous wave (CW) output from a laser. Based on an I/Q modulator, Gao et al. proposed a simplified coherent heterodyne Lidar system [11] and demonstrated that vector velocity and target distance can be measured independently based on the measurement of complex optical field [12]. Based on a dual-sideband FMCW signal generated by a MZM, Xu et al. implemented simultaneous real-time range and velocity measurement for a fast-moving target [13]. Using optical phased arrays in a silicon photonics platform, Poulton et al. proposed a compact FMCW Lidar and performed, simultaneously, distance and velocity measurements [14]. Based on the frequency doubling enabled by photonics, Cheng et al. realized the measured resolution of the range and velocity improved by a factor of 2 [15]. Combining the external modulation with a chip-based soliton microcomb, Riemensberger et al. demonstrated the generation of massively parallel FMCW signals and performed the range and velocity measurements of multiple targets [16].
The ranging resolution, as a key indicator for a Lidar system, has been widely discussed in the literature [8,9,10,11,12,13,14,15,16,17,18,19,20]. Based on the relationship of ( and f are the velocity of light, modulation period, chirp bandwidth and the frequency of de-chirped signal, respectively), the ranging resolution () is considered as , where is the minimum frequency difference that can be distinguished. In Ref. [17], the authors pointed out that, through extending the observed duration of a de-chirped signal, the ranging resolution can be improved and the minimum distinguishable distance difference can be lower than . Adopting the 3-dB bandwidth of de-chirped signal to approximate the distinguishable frequency difference, a ranging resolution smaller than is reported in Refs. [11,12,17,19].
In this work, we establish a dual-sideband FMCW Lidar system to reveal the extreme of the ranging resolution. In such a system, a dual-sideband FMCW signal is generated based on the external modulation technique, and the homodyne detection scheme is adopted to acquire a de-chirped signal. During the experiment, we focus on the dependence of the ranging resolution of this Lidar on the observed duration of the de-chirped signal via two different methods. One is based on a single target, and the ranging resolution is obtained through inspecting the shift of spectral peak position as the target moves. The other is based on two targets, and the ranging resolution is acquired through inspecting the variation of spectrum distribution as the spacing of two targets changes. The experimental results demonstrate that the extreme of the ranging resolution is , and it is not feasible to improve the ranging resolution by extending the observed duration of the de-chirped signal.
2. Experimental Setup and Principle
Figure 1 displays the experimental setup of a dual-sideband FMCW Lidar. A 1550-nm (corresponding frequency = 193.55 THz) continuous wave (CW) with a power of 10 dBm output from a tunable semiconductor laser (TSL, Santec TSL-550, 200 kHz linewidth) is modulated by a MZM (IXblue MXAN-LN-10) after passing through a polarization controller (PC). The MZM is driven by a saw-tooth linear-frequency-modulated (LFM) signal generated by an arbitrary waveform generator (AWG, Tektronix AWG70000, 1.5 KS/s-50 GS/s, 15 GHz bandwidth) and amplified by an electrical amplifier (AMP, Agilent 83006A, 23 dB gain). The PC is used to adjust the polarization state of the light injected into the MZM. The modulated optical signal output from the MZM is divided into two parts by a 30:70 fiber coupler 1 (). The 70% part is sent to the analyzed system. An optical spectrum analyzer (OSA, Aragon Photonics BOSA lite+C, 20-MHz resolution) is used to analyze the optical spectrum, a photodetector 1 (, New Focus 1544B, 12 GHz bandwidth) combined with a digital storage oscilloscope (DSO, Agilent DSO-X91604A, 16 GHz bandwidth) are utilized to record time series, and another PD () (u2t XPDV2120R, 50 GHz bandwidth) jointed by an electrical spectrum analyzer (ESA, R&S_FSW67, 67 GHz bandwidth) are used to measure the power spectrum. The 30% part from the is first amplified by an erbium-doped fiber amplifier (EDFA, Corning) and then is split into two parts by a 50:50 , where one is used as a reference signal and the other is utilized as a transmitted signal. The transmitted signal is sent to a zoom fiber collimator (Thorlabs ZC618APC-C) by an optical circulator (OC) and then projected on a target. The echo signal reflected from the target is collected by the same zoom fiber collimator and combined with the reference signal in a 50:50 . The mixed signal in is detected by , therefore a de-chirped signal can be obtained and is sent to ESA for analysis. In this experiment, we take a plane mirror as target and only consider the light reflected by the mirror. However, in some specific measurement scenarios, the light scattered by the target with different shapes should be considered [21,22,23].
During the experiment, MZM is biased at the null point and is driven by a saw-tooth wave signal with the frequency swept from to within a period of T. Under this case, the output optical field (E) of MZM is a carrier-suppressed dual-sideband FMCW signal, which can be expressed as
where and are the electric-field amplitudes of the dual-sideband optical signal, respectively, is the initial phase, is linear sweep rate, where B is the chirp bandwidth, and are the respectively optical frequencies of the dual-sideband signal, in which and are the frequencies of the optical carrier and the saw-tooth LFM electrical signal, respectively. Figure 2a shows time-frequency analysis of the transmitted signal.
After considering the Doppler frequency shift resulted by the moving target, the optical field of the echo signal is
where is the coefficient of amplitude attenuation, and is the round-trip time related to the distance, R, of the zoom fiber collimator from a target. is the Doppler frequency shift, where and f are the wavelength and frequency of the transmitted signal, respectively, and is the radial velocity of target. The sign of is positive for target moving away from the zoom fiber collimator and negative for moving toward the zoom fiber collimator. Time-frequency analysis of the echo signal is demonstrated in Figure 2b, where the green dashed line is for a static target and the red dotted line is for a target moving toward the zoom fiber collimator. Since the frequency from to is much smaller than , can be regarded as equal over the modulation period T, as shown in Figure 2b.
Regardless of the DC component and high-frequency component larger than , the de-chirped signal can be written as
Based on Equation (3), for a static target, the beat frequency is . However, for a moving target, two beat frequencies located at and can be observed. Under this circumstance, in Figure 2b, for static target, and for target moving toward zoom fiber collimator. As a result, the distance of a static target can be easily calculated by
and the distance and velocity for a moving target can be simultaneously derived as
It is worth noting that there are beat frequencies between the echo signal and the reference signal in the next period, which are denoted as for static target or and for moving target in Figure 2b. Obviously, , and . To avoid the disturbances of such beat frequencies, the detection range R should be no more than . At the same time, the detection range is also limited by the coherence length of ( is the linewidth of laser). Once the detection range exceeds the coherence length, the optical phases of the echo signal and the reference signal are de-correlated. Therefore, for a detected distance of R, the linewidth of laser should be narrower than .
3. Experimental Results and Discussion
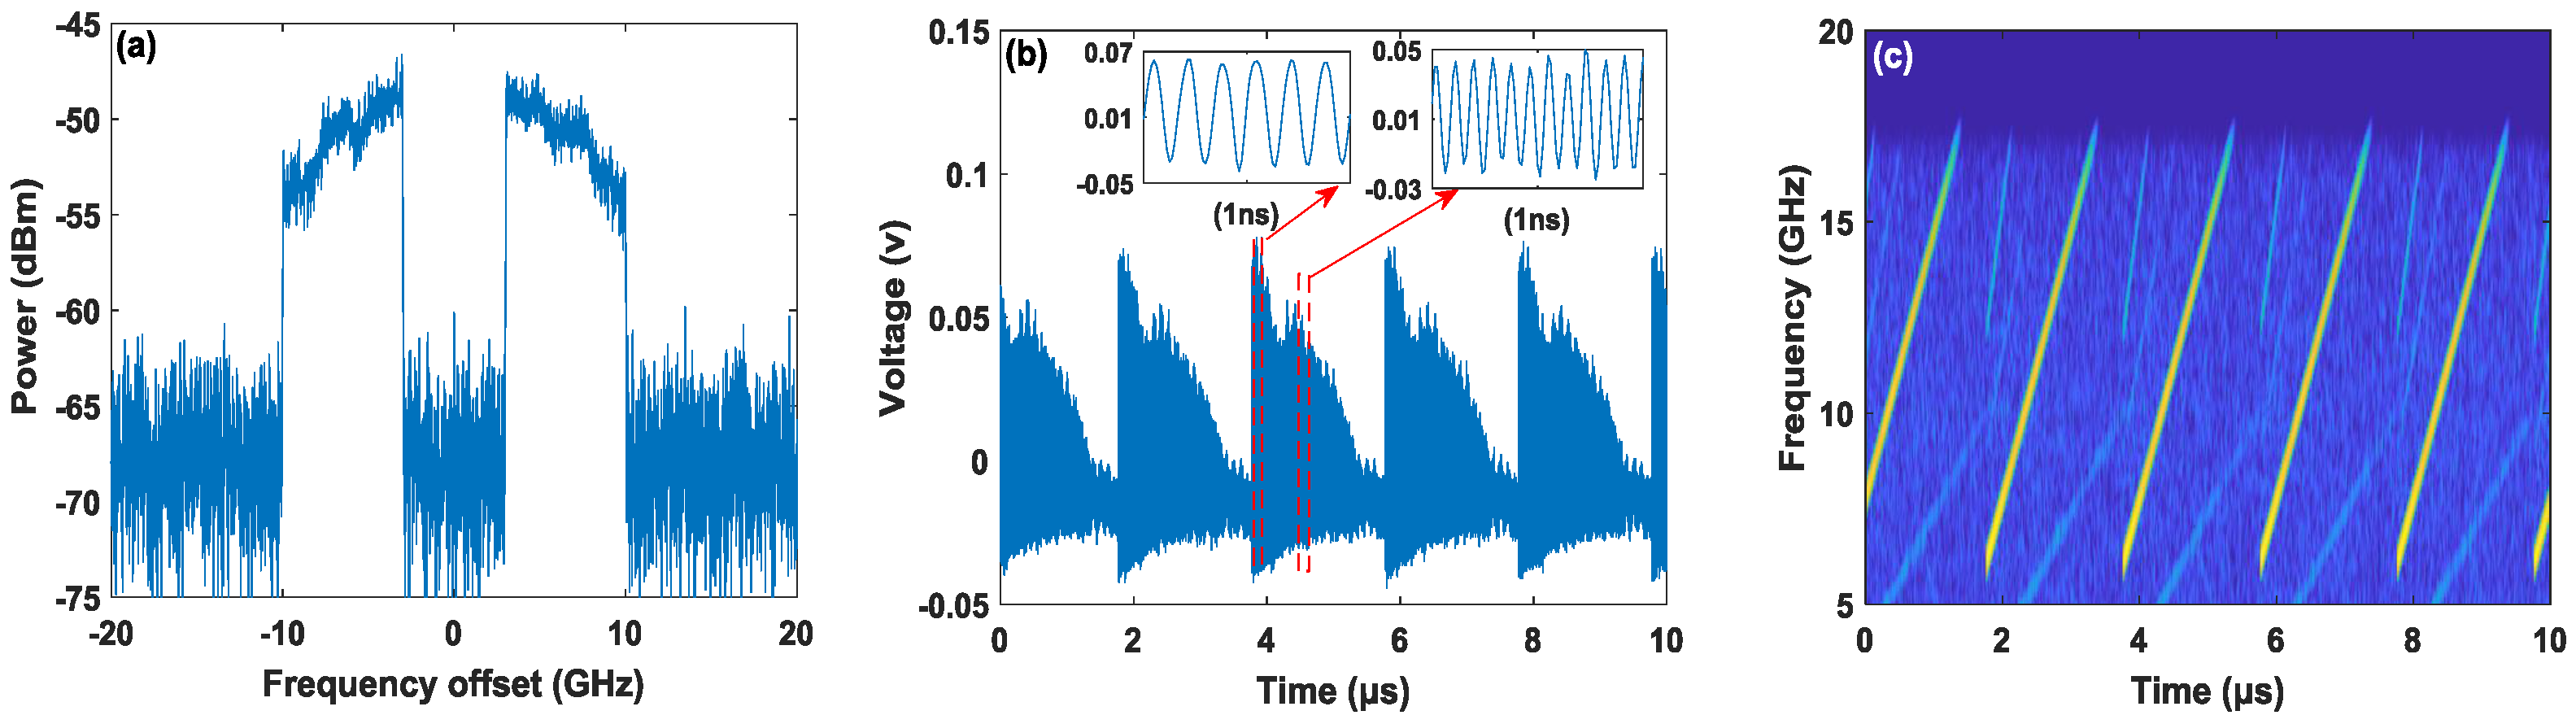
Based on the experimental system shown in Figure 1, we adopt an electric signal with a frequency variation of saw-tooth type to drive MZM. During the experiment, the MZM is biased at its null point (about 12 V), and therefore a carrier-suppressed dual-sideband FMCW signal can be generated. For the electric signal with a frequency swept from 3 to 10 GHz within a period T of 2 μs, the optical spectrum of the generated FMCW signal with the frequency offset to the central frequency of TSL is given in Figure 3a. Obviously, the carrier has been suppressed, and the ±1st-order sidebands emerge at two sides of the carrier frequency. The time series is shown in Figure 3b, where two insets show the enlarged waveforms in two different windows of 1-ns intervals within a period. As shown in Figure 3b, the waveform is periodic with a period of 2 μs and the frequencies corresponding to the two insets are distinctly different. In order to clearly display the variation of the frequency with time, the time-frequency analysis spectrogram is calculated via short-time Fourier transform (STFT) of the time series, and the corresponding result is presented in Figure 3c. It can be seen that the instantaneous frequency linearly increases from 6 to 16 GHz within a period of 2 μs. It should be pointed out that the actual frequency range should be 6-20 GHz, due to the beating between the ±1st-order optical sidebands, which can be verified by the following power spectrum. Limited by the 16 GHz bandwidth of the DSO, the frequency component is not fully presented.
Figure 4a shows the power spectrum of the generated FMCW signal, where both the resolution bandwidth (RBW) and video bandwidth (VBW) of ESA are set at 100 kHz. As shown in this diagram, the swept frequency range is from 6 to 20 GHz. For a smaller frequency range, we record the power spectrum for both the RBW and VBW of ESA set at 1 kHz, and the result is displayed in Figure 4b. A series of sharp frequency comb components separated by 0.5 MHz (the reciprocal of modulation period T of 2 μs) appear in the power spectrum. The comb contrast is about 40 dB, which means that the generated FMCW signal possesses a high repeatability.
Next, we conduct short-range and long-range measurements based on our proposed FMCW Lidar system. Taking a stationary plane mirror placed around 97.7 cm away from the zoom fiber collimator as an example, the power spectrum of the de-chirped signal is shown in Figure 5. As can be seen, the spectral peak is located at 22.8238 MHz, and the corresponding distance is about 97.82 cm based on Equation (4). Under this case, the relative error of the distance is 0.12%. For the mirror at different locations, the distances measured by our proposed FMCW Lidar are in excellent agreement with the actual distances.
Due to the limitation of laboratory space, the measurable distance of the target is relatively small. In order to test the performance of our established Lidar system, we adopt two optical fibers with lengths of 88.643 m and 991.580 m to simulate the case of long-range detection. Based on the above principle analysis, the period of the FMCW is set at 20 μs under this case. Figure 6a presents the power spectrum of de-chirped signal under a fiber length of 88.643 m. The peak of the de-chirped signal, locates at 154.8895 MHz, corresponding to a distance of 88.641 m, and therefore the relative error is 0.002%. For the fiber length of 991.580 m, the power spectrum of de-chirped signal is given in Figure 6b. Under this case, the peak of de-chirped signal locates at 1.7325 GHz, which means that the measured distance is 991.485 m and then the relative error is 0.0096%.
Via our established Lidar system, the ranging resolution of the FMCW Lidar can be analyzed through two different methods. One is based on a single target, and the ranging resolution is extracted through inspecting the shift of peak position in power spectrum as the target moves. The other is based on two targets, and the ranging resolution is acquired through inspecting the variation of spectrum distribution as the spacing of two targets changes. For the first method, a mirror is taken as the single target, and is moved by a step of 5 mm from a reference position. The power spectra of de-chirped signals for the moved distance () taking different values are given in Figure 7, where the period of FMCW signal is 2 μs and the RBW of ESA is set at 1 kHz. Under this circumstance, the duration of the de-chirped signal analyzed by ESA is 500 times of the period of 2 μs. In order to more clearly display the variation of the spectral peak position in Figure 7, in Table 1, we give the beat frequency corresponding to the spectral peak under different moving differences . For , 10 and 15 mm, the spectral peak position is the same as that obtained at the reference position ( mm). However, for mm, the spectral peak position is shifted by 0.5 MHz, which is equal to the reciprocal of modulation period of 2 μs. Further increasing Δd to 35 mm, the spectral peak position is unchanged and is the same as that under mm. As a result, the minimum moving distance that can cause the change of spectral peak position is approximately 20 mm, i.e., the ranging resolution is about 20 mm. Considering that the bandwidth of the FMCW signal is 7 GHz, the ranging resolution is approximately equal to , which is the ranging resolution under the de-chirped signal observed within a period of T. Therefore, the ranging resolution cannot be improved although the spectrum resolution is set at 1 kHz, which means that the observing time is up to .
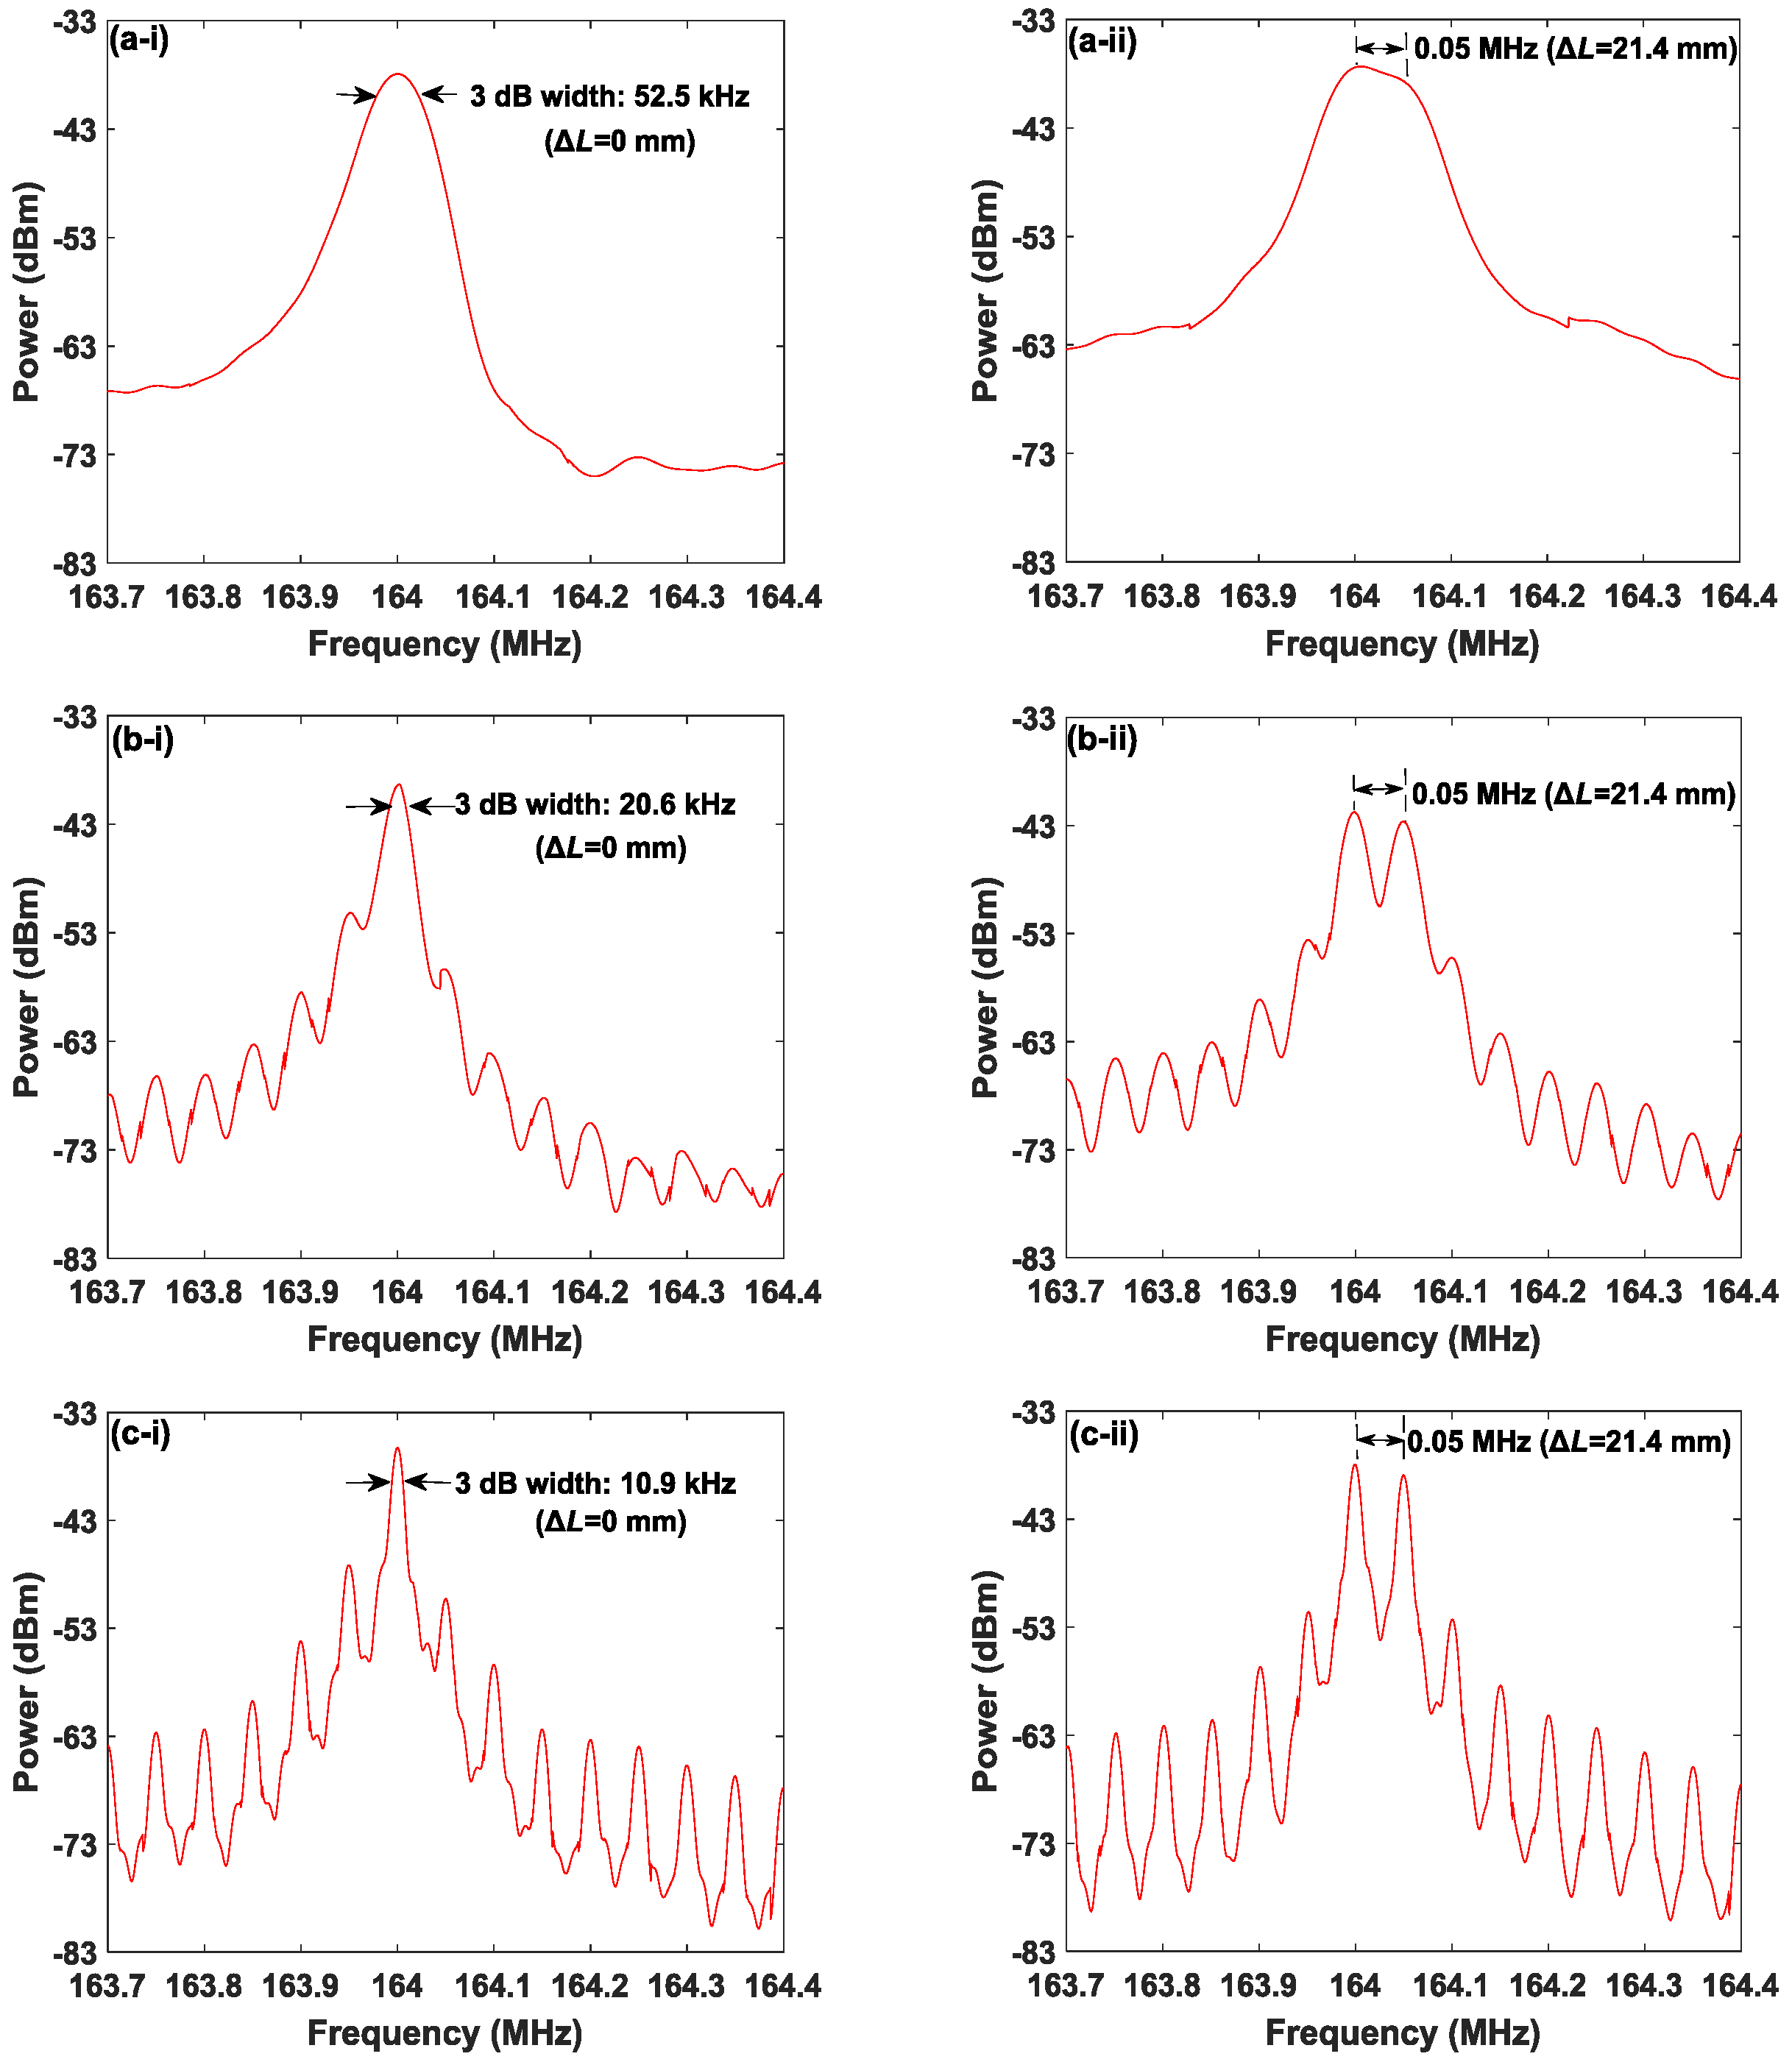
The other method is based on simultaneously detecting two targets, and the ranging resolution is acquired through inspecting the variation of spectrum distribution as the spacing of two targets changes. We use two variable optical delay lines (VODLs) to simulate such a scenario, and the duration of the recorded de-chirped waveform is varied by adjusting the RBW of ESA. The experimental setup is shown in Figure 8, where the generation of FMCW signal is the same as that in Figure 1 and the relationship between the delay change and the length change in VODL is . First, we respectively adjust the two VODLs in two paths so that the optical lengths are the same, and then adjust to produce a distance deviation. In this experiment, the line width of the utilized tunable semiconductor laser is about 200 kHz, and therefore the corresponding coherent length is about 1.5 km. Since the distance deviation between two paths is much less than 1.5 km, the optical phase decorrelation can be neglected. By altering the distance difference with a step of 5 mm, Figure 9 shows the power spectrum of the de-chirped signal. Here, the adopted FWCW signal is generated under the condition of T = 20 μs, and the RBW is set at 50 kHz (a), 20 kHz (b) and 10 kHz (c), respectively. For = 0 mm (as shown in the left column), all spectral peaks locate at 164.0003 MHz, and the 3-dB bandwidths of de-chirped signals are approximately equal to the values of RBW. Meanwhile, there are other frequency comb components separated by 50 kHz (=) and emerging at both sides of the spectral peak in Figure 9(b-i,c-i) due to the temporal coherence. For varied within (0, 20 mm), power spectra under different RBW are similar with that obtained under = 0 mm. However, as increases to about 21.4 mm (as shown in the right column), two distinguishable peaks with comparable amplitude emerge in all power spectra. All the frequency differences between two distinguishable peaks are 0.05 MHz (=), and the corresponding ranging resolutions are 21.4 mm, which is equal to . Table 2 summarizes the 3-dB bandwidth and the ranging resolution under different RBW. Therefore, the ranging resolution cannot be improved by extending the observed duration of the de-chirped signal. The reason for that is as follows. FMCW signal is a periodic signal with a period of T, which causes the power spectrum of the de-chirped signalm, composed of a series of frequency comb components separated by . Only when the frequency difference induced by the movement of target reaches a comb spacing, the spectral peak will be changed and shift to the next comb tooth. As a result, the extreme of ranging resolution in a FMCW Lidar is .
4. Conclusions
Based on an established FMCW Lidar system, we, experimentally, have explored the dependence of the ranging resolution on the observed duration of a de-chirped signal via two different methods. The first method is based on a single target, and the ranging resolution is extracted through inspecting the shift of peak position in power spectrum as the target moves. The other is based on two targets, and the ranging resolution is acquired through inspecting the variation of spectrum distribution as the spacing of two targets changes. The experimental results indicate that the ranging resolution cannot be improved by observing longer de-chirped waveform, and the extreme of ranging resolution is . Although above conclusion is obtained based on this established FMCW Lidar system, it can be generalized to other FMCW Lidar systems.
Author Contributions
Methodology, Z.X. and G.X.; validation, Z.X. and G.X.; investigation, Z.X. and Z.J.; writing—original draft preparation, Z.X.; writing—review and editing, G.X., Z.W. and D.Y. All authors have read and agreed to the published version of the manuscript.
Funding
This research was funded by the National Natural Science Foundation of China (Grant Nos. 61775184 and 61875167).
Institutional Review Board Statement
Not applicable.
Informed Consent Statement
Not applicable.
Data Availability Statement
Not applicable.
Conflicts of Interest
The authors declare no conflict of interest.
References
- Adany, P.; Allen, C.; Hui, R.Q. Chirped lidar using simplified homodyne detection. J. Light. Technol. 2009, 27, 3351–3357. [Google Scholar] [CrossRef]
- Quatrevalet, M.; Ai, X.; Pérez-Serrano, A.; Adamiec, P.; Barbero, J.; Fix, A.; Tijero, J.M.G.; Esquivias, I.; Rarity, J.G.; Ehret, G. Atmospheric CO2 sensing with a random modulation continuous wave integrated path differential absorption lidar. IEEE J. Sel. Top. Quantum Electron. 2017, 23, 5300311. [Google Scholar] [CrossRef]
- Ma, Y.C.; Anderson, J.; Crouch, S.; Shan, J. Moving object detection and tracking with Doppler lidar. Remote Sens. 2019, 11, 1154. [Google Scholar] [CrossRef] [Green Version]
- Zhang, J.X.; Jiang, W.J.; Yu, Y.; Zhang, X.L. Photonics-based simultaneous measurement of distance and velocity using multi-band LFM microwave signals with opposite chirps. Opt. Express 2019, 27, 27580–27591. [Google Scholar] [CrossRef] [PubMed]
- Hasch, J.; Topak, E.; Schnabel, R.; Zwick, T.; Weigel, R.; Waldschmidt, C. Millimeter-wave technology for automotive radar sensors in the 77 GHz frequency band. IEEE Trans. Microw. Theory Tech. 2012, 60, 845–860. [Google Scholar] [CrossRef]
- Xu, Z.Y.; Chen, K.; Sun, X.Y.; Zhang, K.L.; Wang, Y.C.; Deng, J.; Pan, S.L. Frequency-modulated continuous-wave coherent Lidar with downlink communications capability. IEEE Photonics Technol. Lett. 2020, 32, 655–658. [Google Scholar] [CrossRef]
- Li, C.Z.; Lubecke, V.M.; Boric-Lubecke, O.; Lin, J.S. A review on recent advances in Doppler radar sensors for noncontact healthcare monitoring. IEEE Trans. Microw. Theory Tech. 2013, 61, 2046–2060. [Google Scholar] [CrossRef]
- Kakuma, S. Frequency-modulated continuous-wave laser radar using dual vertical-cavity surface-emitting laser diodes for real-time measurements of distance and radial velocity. Opt. Rev. 2017, 24, 39–46. [Google Scholar] [CrossRef]
- Zhang, X.S.; Pouls, J.; Wu, M.C. Laser frequency sweep linearization by iterative learning pre-distortion for FMCW Lidar. Opt. Express 2019, 27, 9965–9974. [Google Scholar] [CrossRef]
- Zhang, F.M.; Yi, L.P.; Qu, X.H. Simultaneous measurements of velocity and distance via a dual-path FMCW lidar system. Opt. Commun. 2020, 474, 126066. [Google Scholar] [CrossRef]
- Gao, S.; Hui, R. Frequency-modulated continuous-wave lidar using I/Q modulator for simplified heterodyne detection. Opt. Lett. 2012, 37, 2022–2024. [Google Scholar] [CrossRef] [PubMed] [Green Version]
- Gao, S.; O’Sullivan, M.; Hui, R.Q. Complex-optical-field lidar system for range and vector velocity measurement. Opt. Express 2012, 20, 25867–25875. [Google Scholar] [CrossRef]
- Xu, Z.Y.; Tang, L.Z.; Zhang, H.X.; Pan, S.L. Simultaneous real-time ranging and velocimetry via a dual-sideband chirped lidar. IEEE Photonics Technol. Lett. 2017, 29, 2254–2257. [Google Scholar] [CrossRef]
- Poulton, C.V.; Yaacobi, A.; Cole, D.B.; Byrd, M.J.; Raval, M.; Vermeulen, D.; Watts, M.R. Coherent solid-state Lidar with silicon photonic optical phased arrays. Opt. Lett. 2017, 42, 4091–4094. [Google Scholar] [CrossRef] [PubMed]
- Cheng, H.X.; Zou, X.H.; Lu, B.; Jiang, Y. High-resolution range and velocity measurement based on photonic LFM microwave signal generation and detection. IEEE Photonics J. 2019, 11, 7200808. [Google Scholar] [CrossRef]
- Riemensberger, J.; Lukashchuk, A.; Karpov, M.; Weng, W.L.; Lucas, E.; Liu, J.Q.; Kippenberg, T.J. Massively parallel coherent laser ranging using a soliton microcomb. Nature 2020, 581, 164–170. [Google Scholar] [CrossRef]
- Xu, Z.Y.; Zhang, H.X.; Chen, K.; Zhu, D.; Pan, S.L. FMCW lidar using phase-diversity coherent detection to avoid signal aliasing. IEEE Photonics Technol. Lett. 2019, 31, 1822–1825. [Google Scholar] [CrossRef]
- Drechsel, T.; Joram, N.; Ellinger, F. An ultra-wideband 6–14 GHz frequency modulated continuous wave primary radar with 3 cm range resolution. Integration 2020, 75, 19–29. [Google Scholar] [CrossRef]
- Baumann, E.; Giorgetta, F.R.; Coddington, I.; Sinclair, L.C.; Knabe, K.; Swann, W.C.; Newbury, N.R. Comb-calibrated frequency-modulated continuous-wave ladar for absolute distance measurements. Opt. Lett. 2013, 38, 2026–2028. [Google Scholar] [CrossRef]
- Piracha, M.U.; Nguyen, D.; Mandridis, D.; Yilmaz, T.; Ozdur, I.; Ozharar, S.; Delfyett, P.J. Range resolved lidar for long distance ranging with sub-millimeter resolution. Opt. Express 2010, 18, 7184–7189. [Google Scholar] [CrossRef] [Green Version]
- Valagiannopoulos, C.A.; Uzunoglu, N.K. Rigorous analysis of a metallic circular post in a rectangular waveguide with step discontinuity of sidewalls. IEEE Trans. Microw. Theory Tech. 2007, 55, 1673–1684. [Google Scholar] [CrossRef]
- Kargl, S.G.; Shim, T.; Williams, K.L.; Im, S. Scattering from a finite cylindrical target in a waveguide. In Proceedings of the OCEANS 2016 MTS/IEEE Monterey, Monterey, CA, USA, 19–23 September 2016; pp. 1–5. [Google Scholar]
- Valagiannopoulos, C.A. Electromagnetic propagation into parallel-plate waveguide in the presence of a skew metallic surface. Electromagnetics 2011, 31, 593–605. [Google Scholar] [CrossRef]
Figure 1.
Experimental setup of dual-sideband FMCW Lidar. TSL: tunable semiconductor laser; PC: polarization controller; AWG: arbitrary waveform generator; AMP: electrical amplifier; MZM: Mach-Zehnder modulator; FC: fiber coupler; OSA: optical spectrum analyzer; PD: photodetector; DSO: digital storage oscilloscope; ESA: electrical spectrum analyzer; EDFA: erbium-doped fiber amplifier; OC: optical circulator.

Figure 2.
(a) Time-frequency analysis of transmitted signal. (b) time-frequency analysis of echo signal for static target (green dashed line) and moving target (red dotted line).
Figure 2.
(a) Time-frequency analysis of transmitted signal. (b) time-frequency analysis of echo signal for static target (green dashed line) and moving target (red dotted line).

Figure 3.
(a) Optical spectrum of generated FMCW signal with the frequency offset to the central frequency of TSL, (b) time series of generated FMCW signal (insets: zoom-in views in temporal duration of 1 ns), and (c) time-frequency analysis spectrogram based on STFT of the time series.
Figure 3.
(a) Optical spectrum of generated FMCW signal with the frequency offset to the central frequency of TSL, (b) time series of generated FMCW signal (insets: zoom-in views in temporal duration of 1 ns), and (c) time-frequency analysis spectrogram based on STFT of the time series.

Figure 4.
Measured power spectrum of the generated FMCW signal, where (a) RBW: 100 kHz and VBW: 100 kHz; (b) RBW: 1 kHz and VBW: 1 kHz.
Figure 4.
Measured power spectrum of the generated FMCW signal, where (a) RBW: 100 kHz and VBW: 100 kHz; (b) RBW: 1 kHz and VBW: 1 kHz.

Figure 5.
Power spectrum of de-chirped signal for the target located at 97.7 cm, where the RBW and VBW of ESA are 1 MHz and 1 kHz, respectively.
Figure 5.
Power spectrum of de-chirped signal for the target located at 97.7 cm, where the RBW and VBW of ESA are 1 MHz and 1 kHz, respectively.

Figure 6.
Power spectra for de-chirped signals under adopting 88.643 m (a) and 991.580 m (b) fibers to simulate long range detection. RBW: 1 MHz, VBW: 1 kHz.
Figure 6.
Power spectra for de-chirped signals under adopting 88.643 m (a) and 991.580 m (b) fibers to simulate long range detection. RBW: 1 MHz, VBW: 1 kHz.

Figure 7.
Power spectrum of de-chirped signal under T = 2 μs and different moving distance . RBW: 1 kHz, and VBW: 1 kHz.
Figure 7.
Power spectrum of de-chirped signal under T = 2 μs and different moving distance . RBW: 1 kHz, and VBW: 1 kHz.

Figure 8.
Experimental setup for exploring ranging resolution. VODL: variable optical delay line.

Figure 9.
Power spectra of de-chirped signals under (i) 0 mm distance difference and (ii) approximately 21.4-mm distance difference for the RBW of (a) 50, (b) 20 and (c) 10 kHz. VBW: 1 kHz. Modulation period: 20 μs.
Figure 9.
Power spectra of de-chirped signals under (i) 0 mm distance difference and (ii) approximately 21.4-mm distance difference for the RBW of (a) 50, (b) 20 and (c) 10 kHz. VBW: 1 kHz. Modulation period: 20 μs.


Table 1.
The beat frequency corresponding to the spectral peak under different moving difference .
| Moving Distance (mm) | Beat Frequency (MHz) |
|---|---|
| 0 | 150.498 |
| 5 | 150.498 |
| 10 | 150.498 |
| 15 | 150.498 |
| 20 | 150.998 |
| 25 | 150.998 |
| 30 | 150.998 |
| 35 | 150.998 |
Table 2.
The 3-dB bandwidth and the ranging resolution under different RBW.
| RBW (kHz) | 3-dB Width (kHz) | Ranging Resolution (mm) |
|---|---|---|
| 50 | 52.5 | 21.4 |
| 20 | 20.6 | 21.4 |
| 10 | 10.9 | 21.4 |
Publisher’s Note: MDPI stays neutral with regard to jurisdictional claims in published maps and institutional affiliations. |
© 2021 by the authors. Licensee MDPI, Basel, Switzerland. This article is an open access article distributed under the terms and conditions of the Creative Commons Attribution (CC BY) license (https://creativecommons.org/licenses/by/4.0/).
Share and Cite
MDPI and ACS Style
Xiao, Z.; Wu, Z.; Jiang, Z.; Yue, D.; Xia, G. Experimental Investigation on the Ranging Resolution of a FMCW Lidar. Photonics 2022, 9, 11. https://doi.org/10.3390/photonics9010011
AMA Style
Xiao Z, Wu Z, Jiang Z, Yue D, Xia G. Experimental Investigation on the Ranging Resolution of a FMCW Lidar. Photonics. 2022; 9(1):11. https://doi.org/10.3390/photonics9010011
Chicago/Turabian StyleXiao, Zhenzhen, Zhengmao Wu, Zaifu Jiang, Dianzuo Yue, and Guangqiong Xia. 2022. "Experimental Investigation on the Ranging Resolution of a FMCW Lidar" Photonics 9, no. 1: 11. https://doi.org/10.3390/photonics9010011
Note that from the first issue of 2016, this journal uses article numbers instead of page numbers. See further details here.