3.1. Fluorescence Measurement
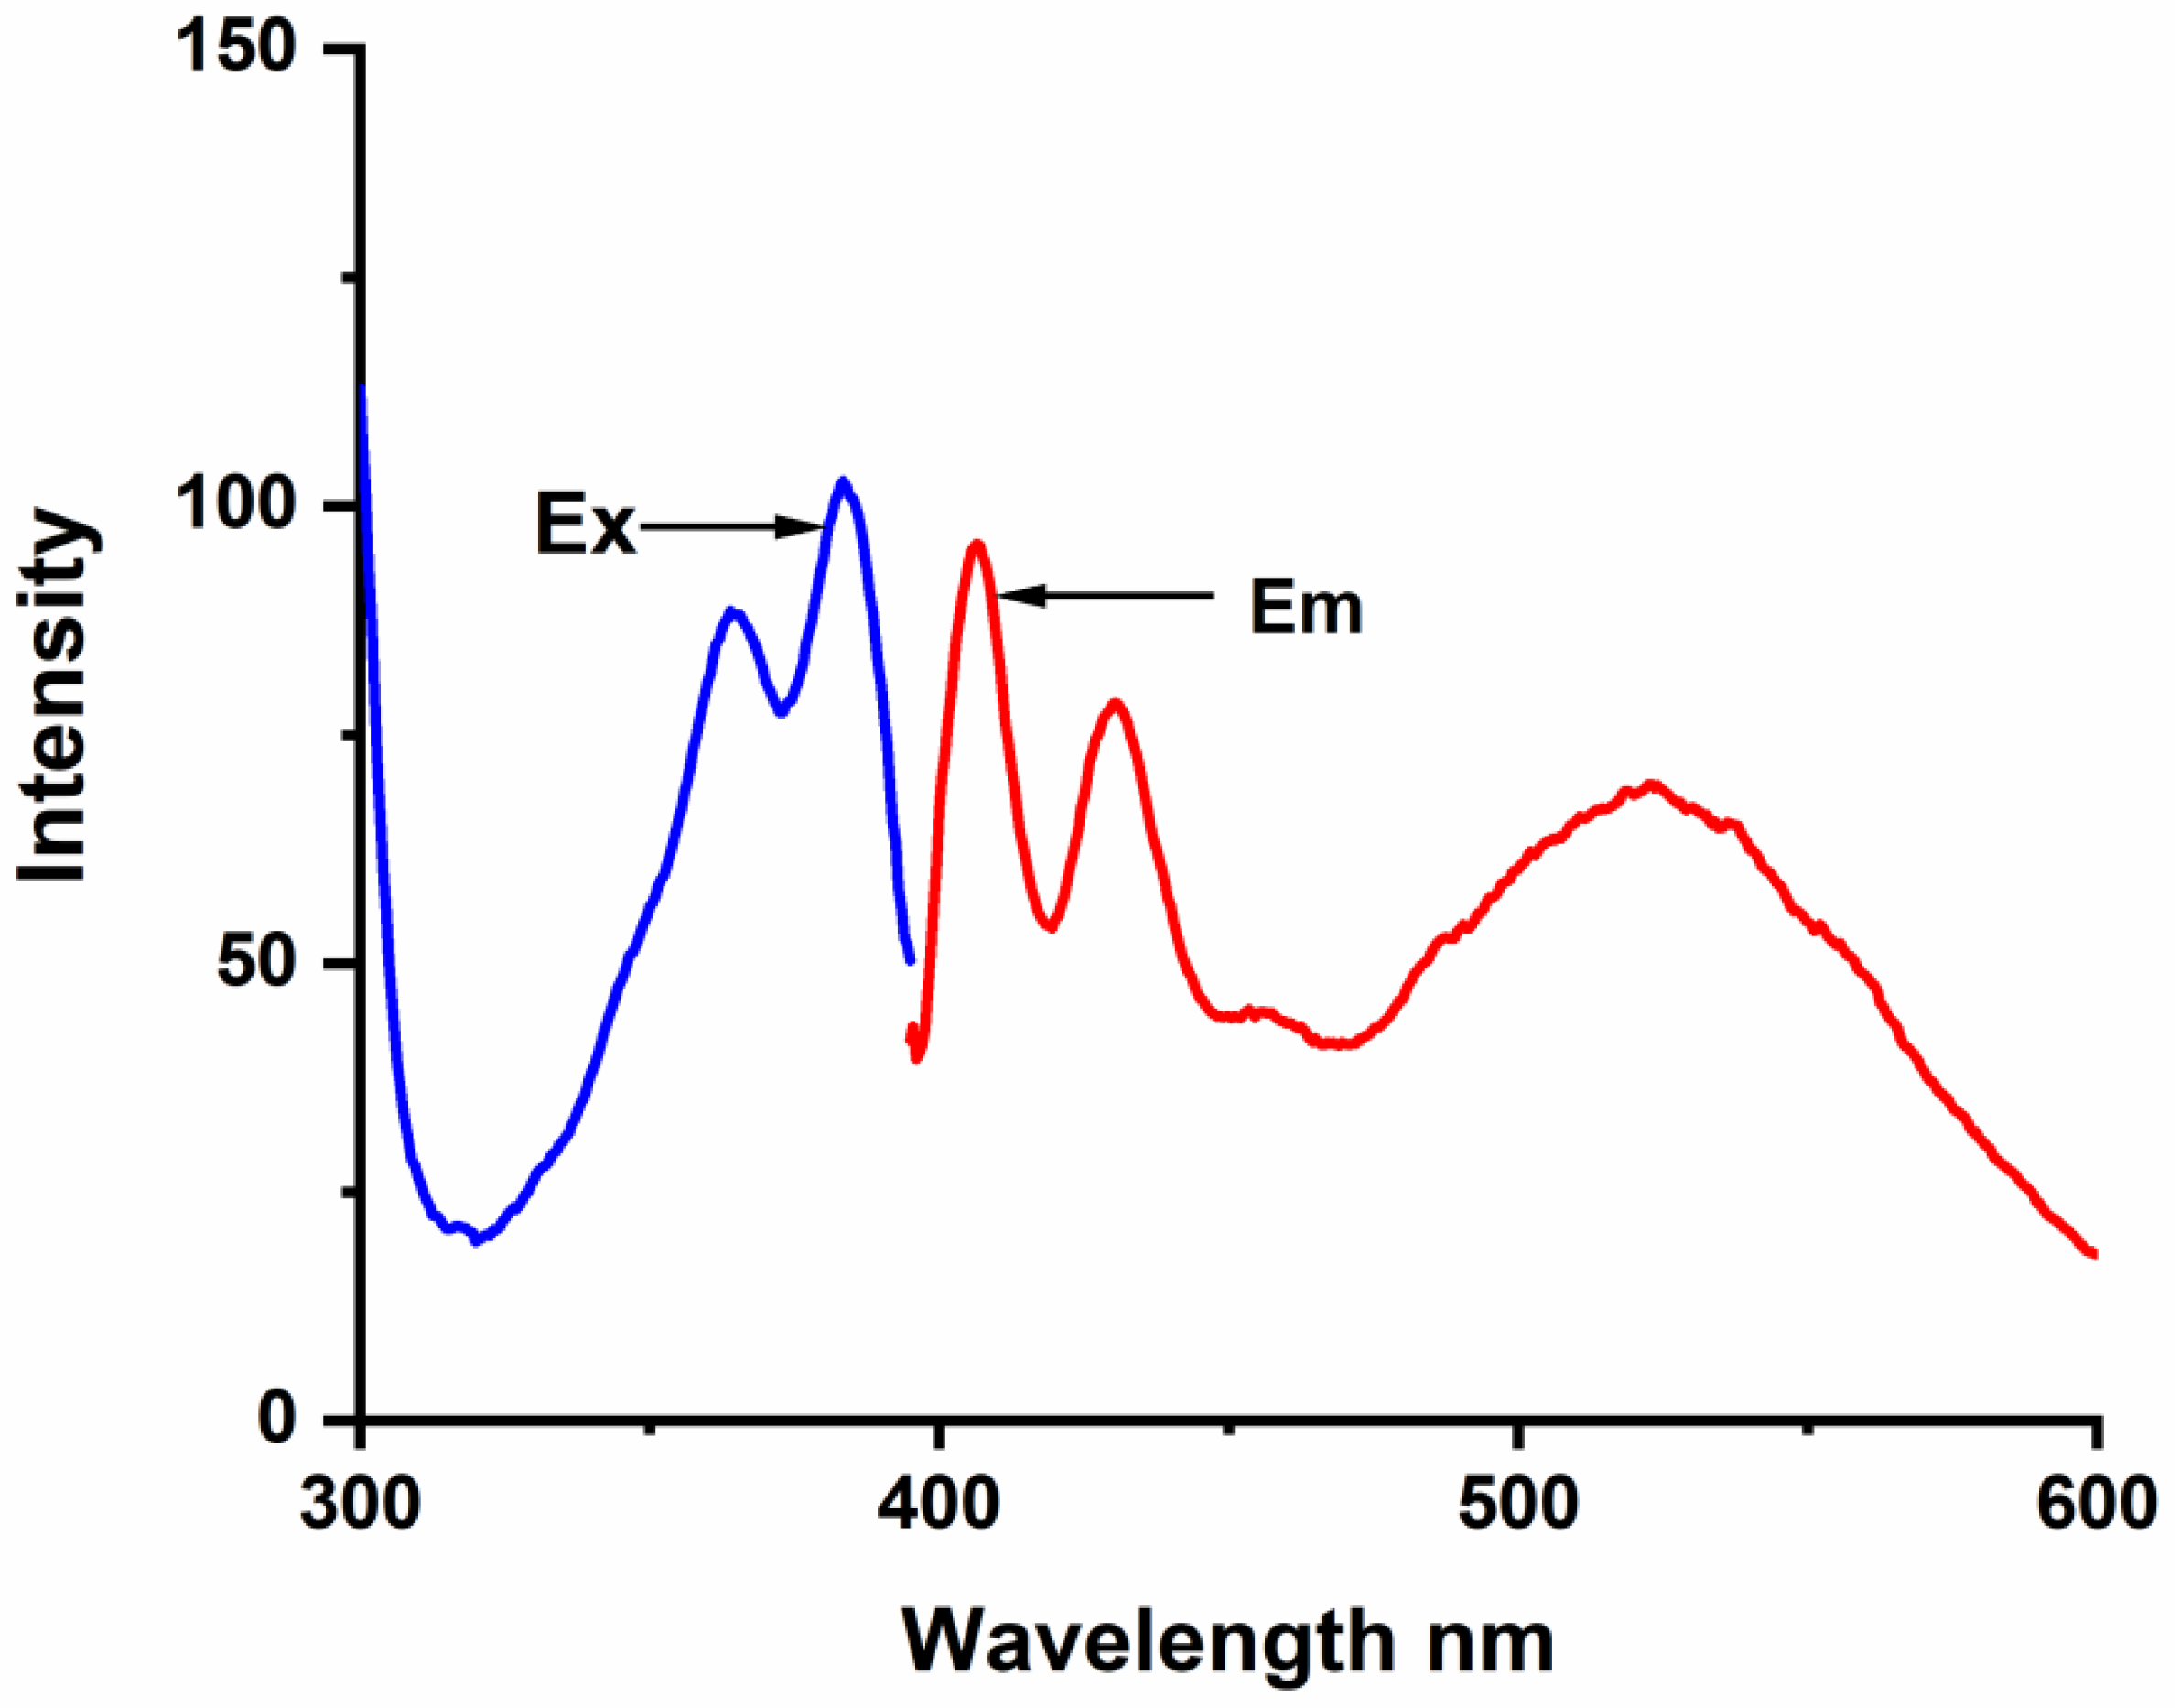
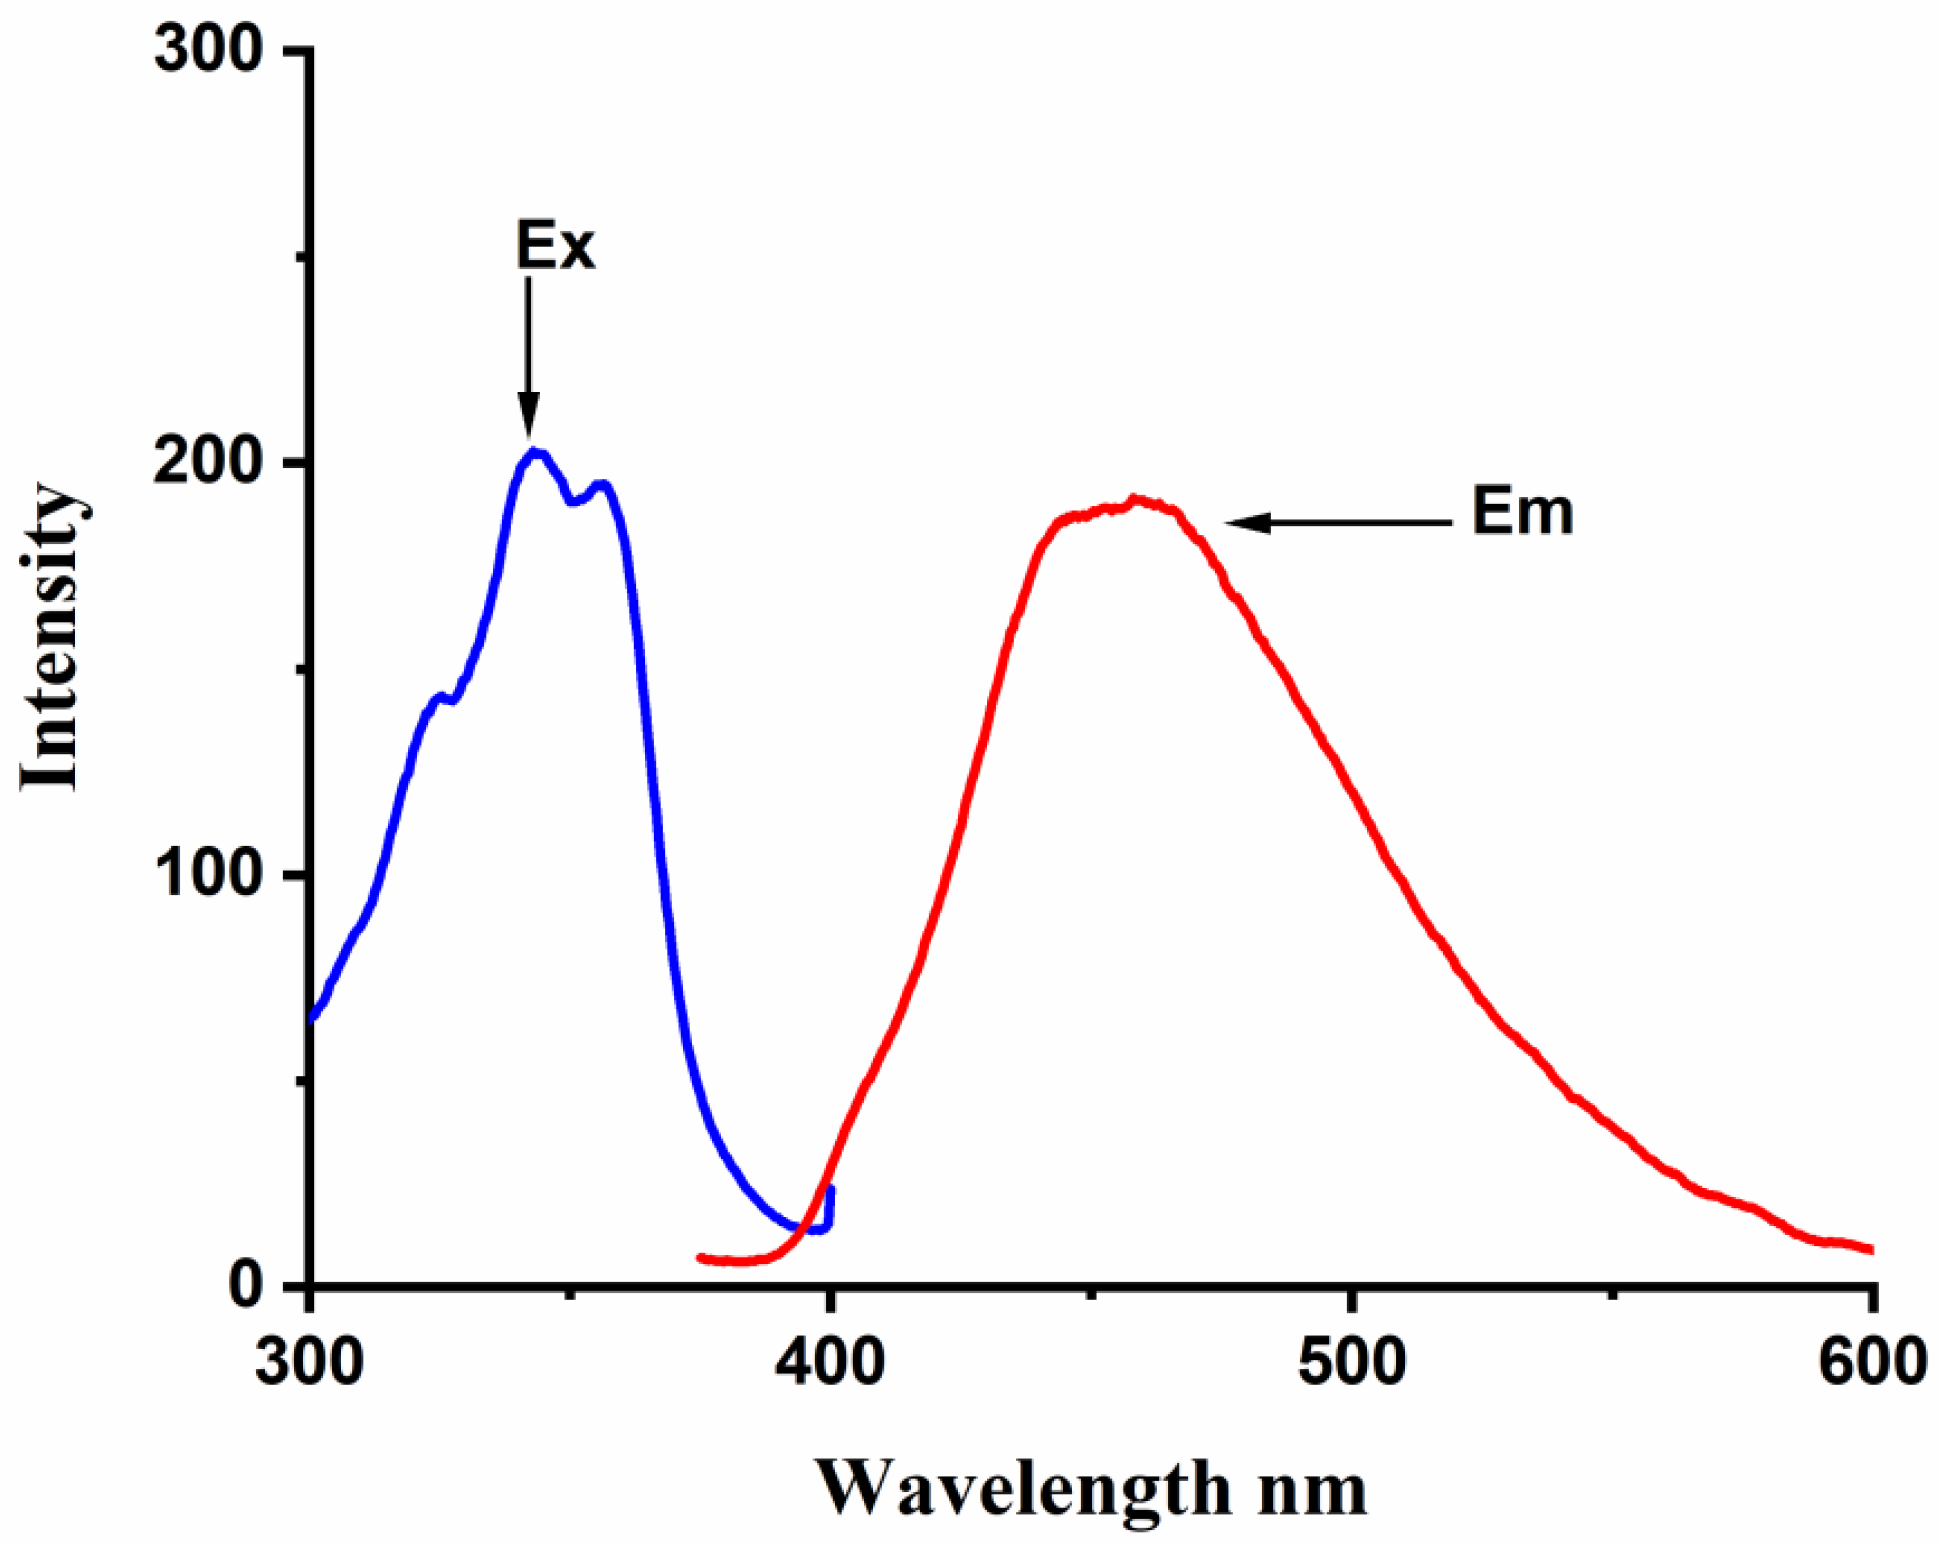
The complex formation between BaP, FLT, and CB[n] (n = 6–8) hosts was studied carefully by the spectrofluorimetric technique. The fluorescence emission spectrum of BaP shows two intense characteristic vibronic structure emission bands at 405 and 420 nm and a broader less intense one at 540 nm when excited at 385 nm (
Figure 2). At high BaP concentration, a structureless broad peak appears at 540 nm, we have noticed that this broad peak is vanishing at low concentration (less than 5 × 10
−7 M) and upon complexation. According to the literature, some organic molecules tend to form aggregates in aqueous media through π-π type interactions between the aromatic rings [
30]; specifically, BaP forms ground-state pairs that exhibit a redshift in the fluorescence spectrum compared to the concerning monomer [
2]. Hence, we infer that this peak is for an excimer species.
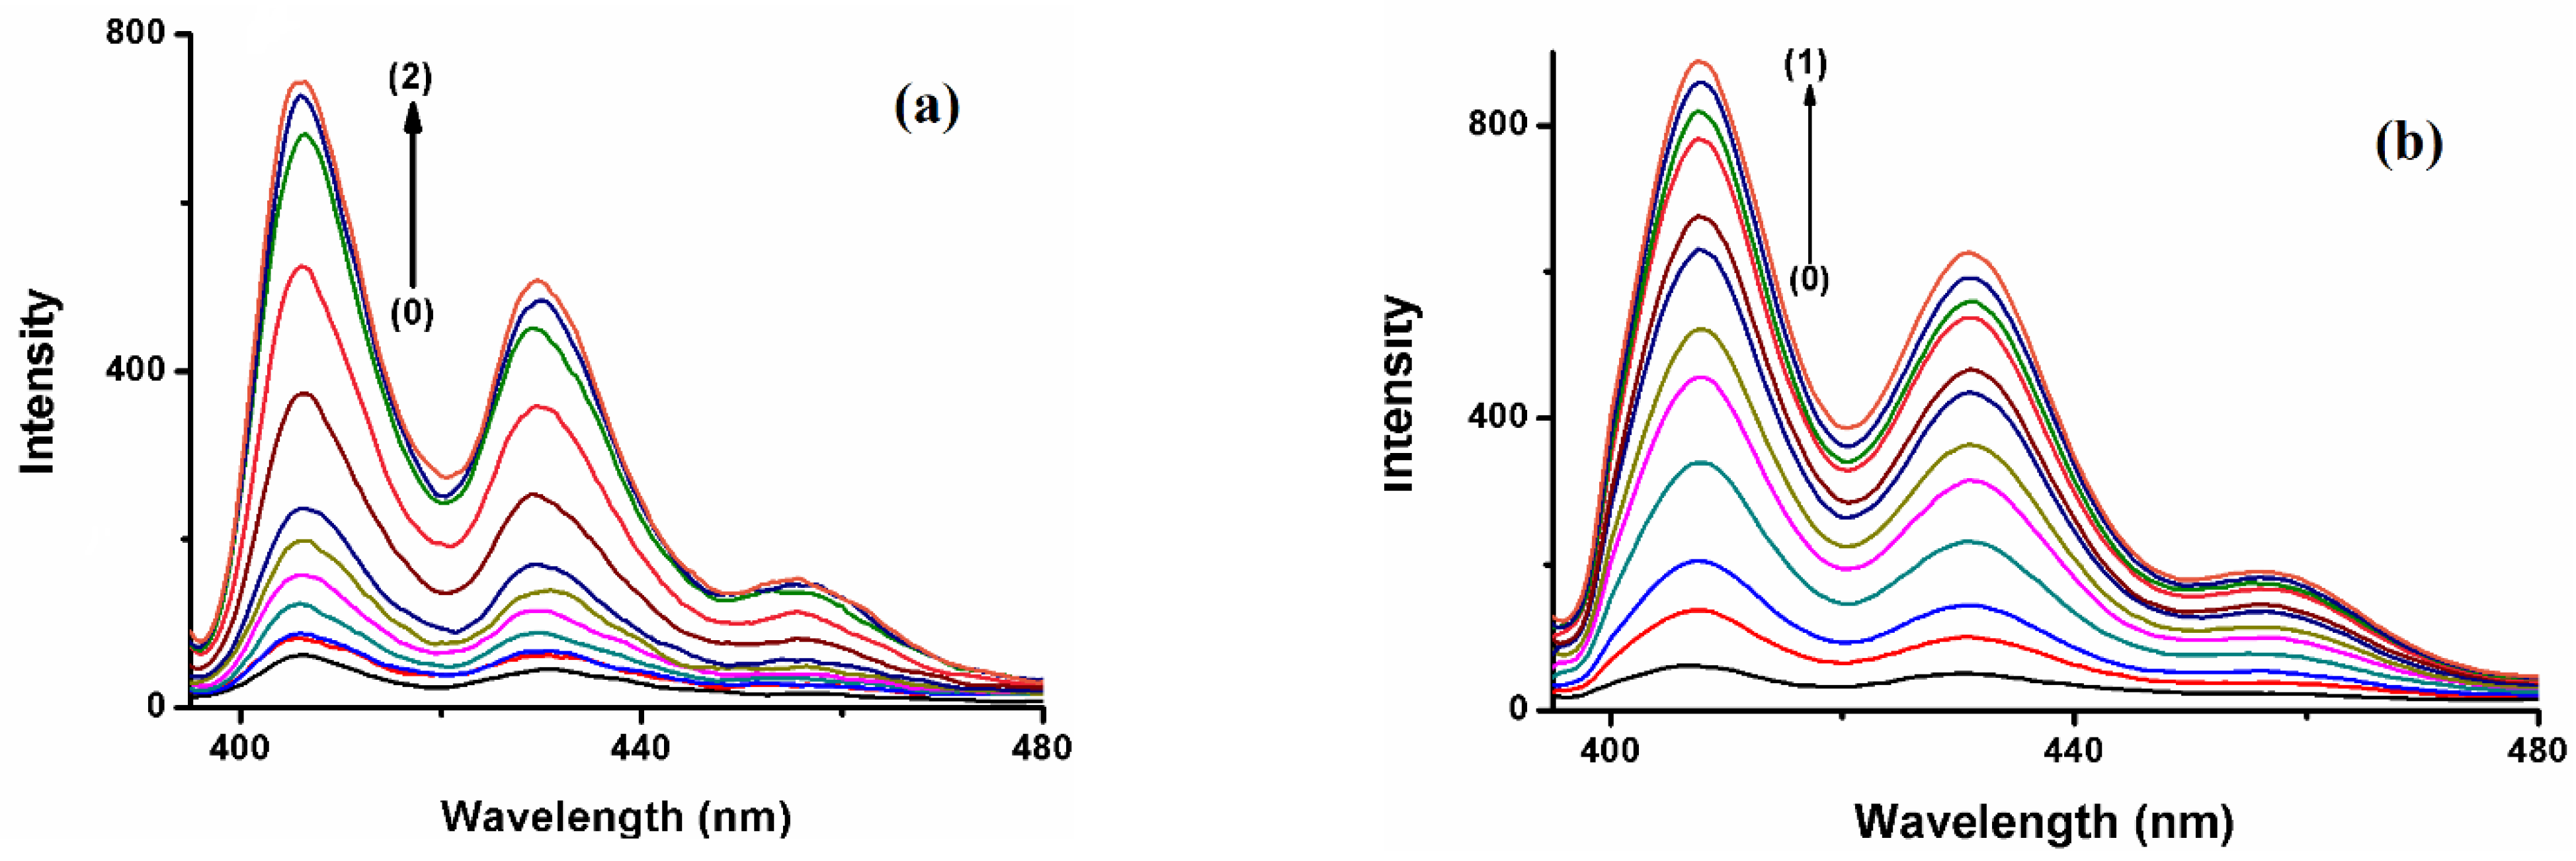
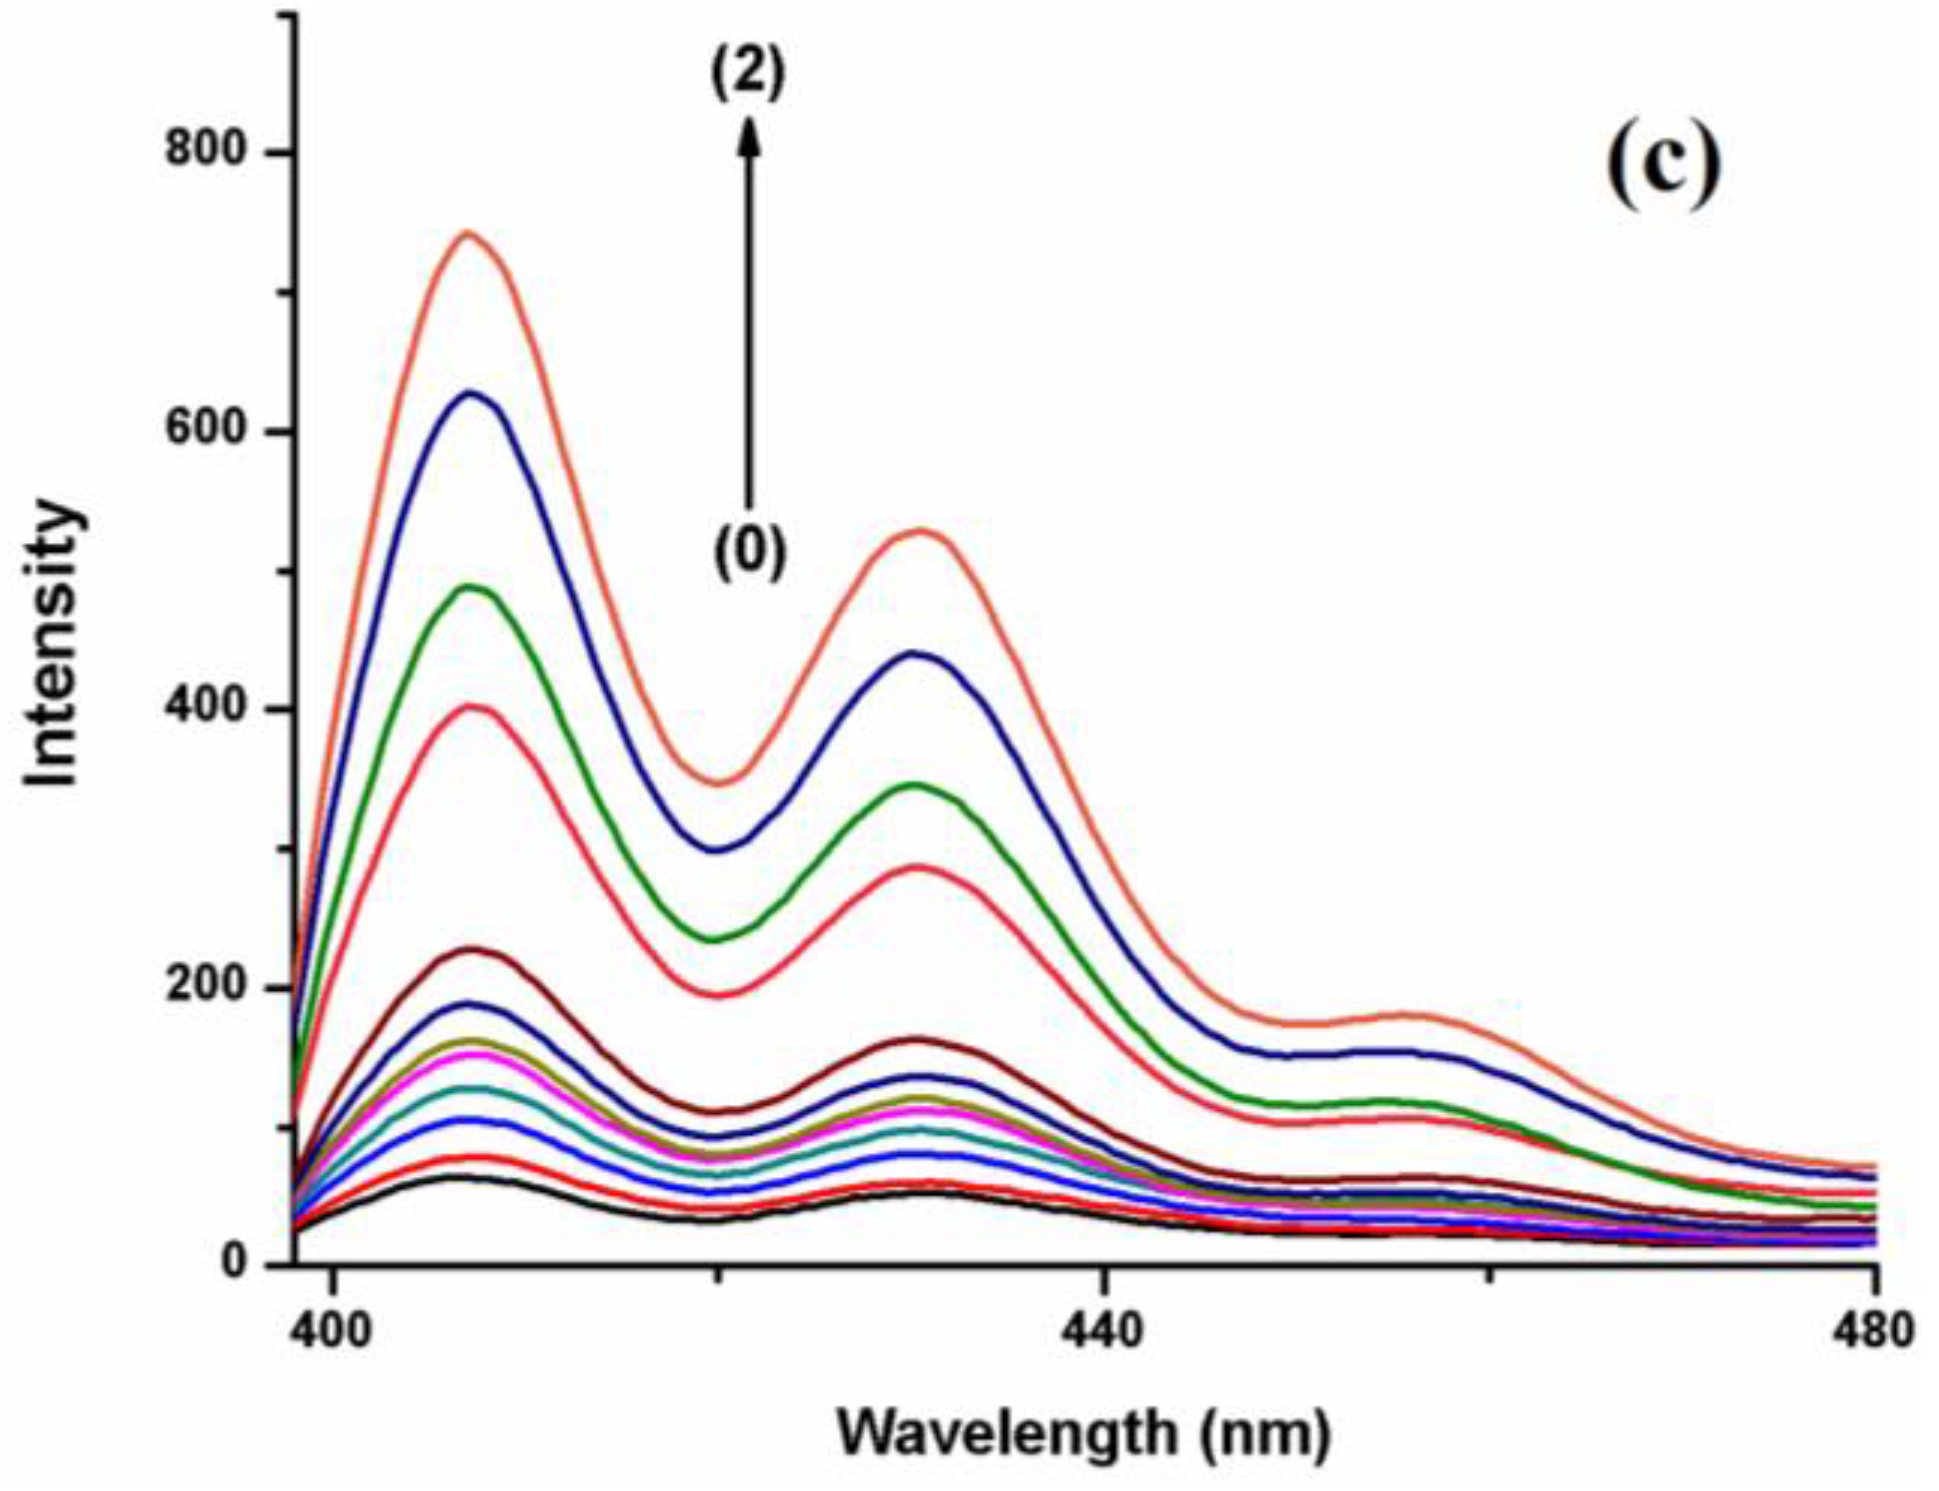
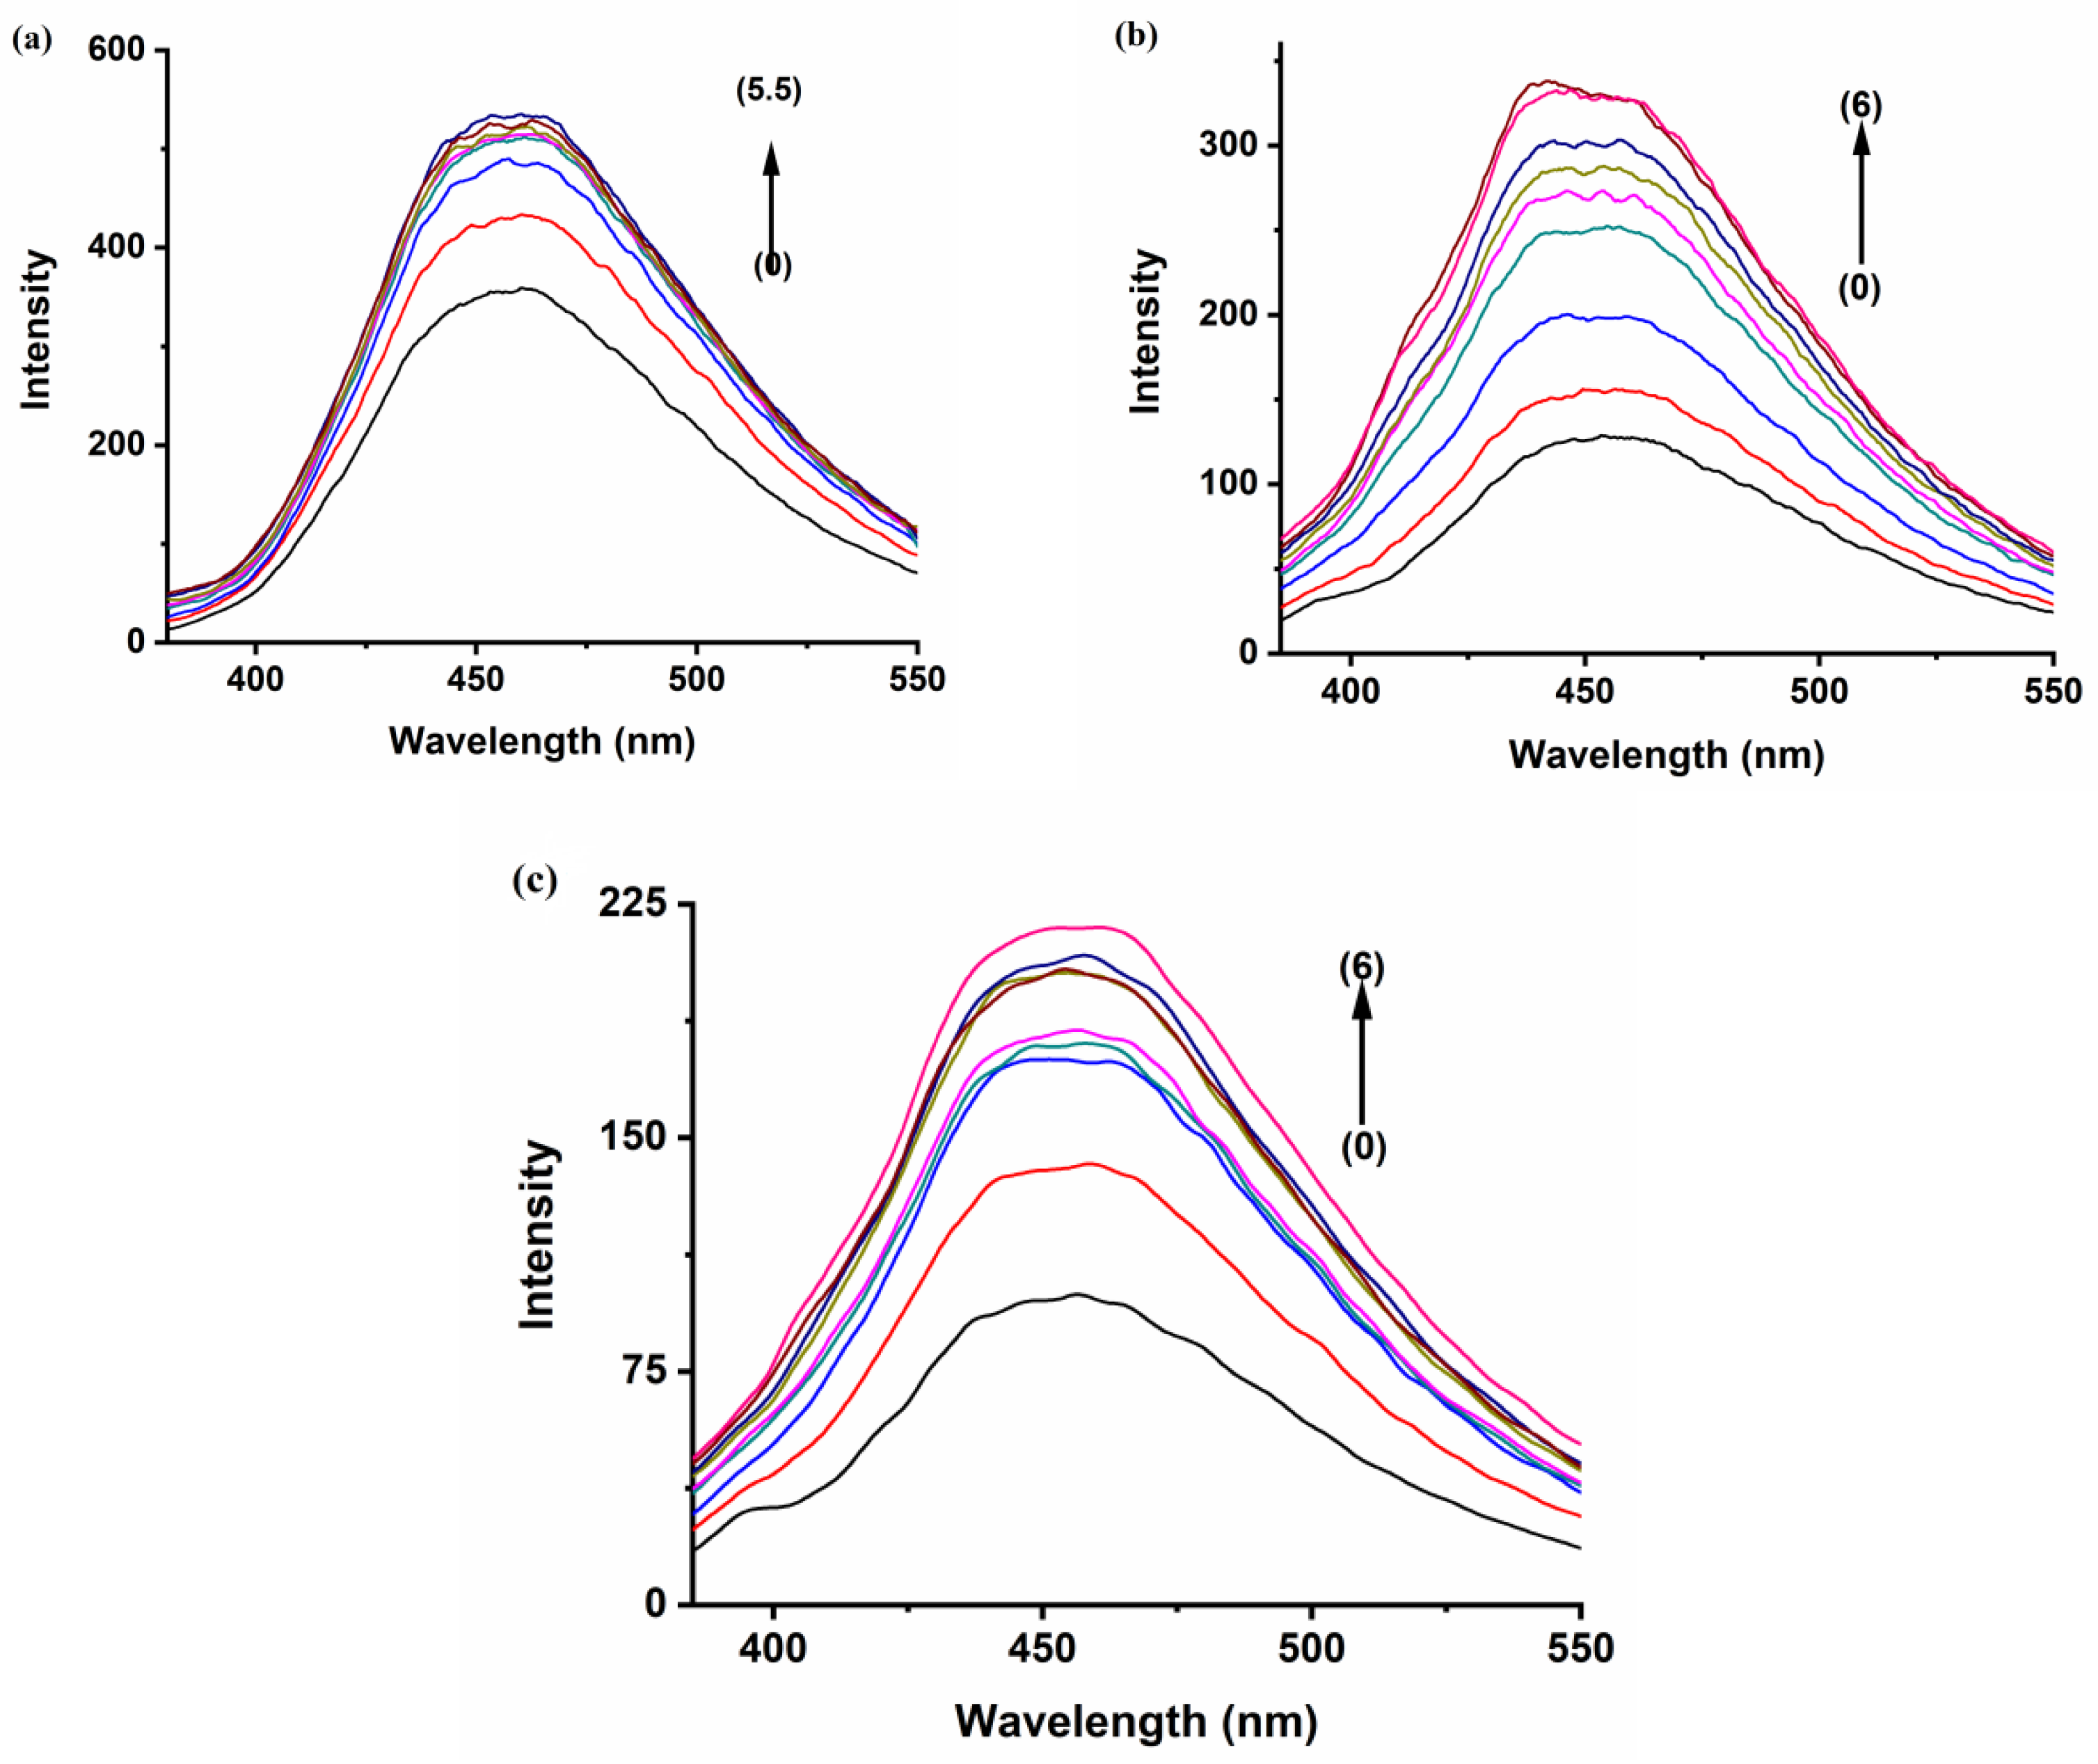
The fluorescence emission spectrum of the polyaromatic compound BaP solution (5 × 10
−7 M) displays a distinct enhancement on the 405 and 420 nm bands upon the addition of the three hosts, whereas the peak at 540 shows a monotonous increase in intensity with the increase in the hosts’ concentration (
Figure 3). These results indicate that there is an interaction between BaP and the hosts. Previous research found that the formation of stable inclusion complexes is an exquisite or refined equilibrium between hydrophobicity, charge, shape, and size of the guest and host [
31], and it is known that spectra of a fluorescent molecule may be affected when it is included or inserted inside a hydrophobic cavity [
32]. Furthermore, the rigidity of the local environment and the polarity of the solvent affects the fluorescence emission spectra, while the nonpolar cavity also stabilizes the nonpolar excited state, resulting in emission at a lower energy or longer wavelength [
33]. Consequently, in the presence of CB[n], the nonpolar B[a]P and FLT move from the polar aqueous media to the nonpolar environment (rigid cavity, or externally associate with the host).
The hydrophobic cavity of a cucurbituril encapsulates water molecules, which have high energy in accordance with their nonpolar cavities, and due to the weak dispersion interactions with weakly polarizable CB[n] cavity walls. Hence, the environment inside the cavity is not comfortable for these water molecules, which have stabilized themselves by hydrogen bonding interaction outside the cavity (bulk and portals). In return for that, the addition of hydrophobic molecules or moiety to the cavity and expulsion of high-energy water molecules is a highly exothermic process [
34]. Moreover, the inclusion process results in the protection of the guest from the quenching effects of the bulk solvent and hence minimization of non-radiative decay pathways [
35]. Among the three hosts, the enhancement of the fluorescence of BaP in the presence of CB[7] is higher than in the other hosts, even at a much lower concentration (
Figure 3b). The size of CB[7] seems to be the most compatible with the guest size compared to the other hosts, hence comfortably encapsulating most of the BaP molecule. On the other hand, the polarity of the CB[7] solvent causes the BaP to be shunned from the medium to the hydrophobic host cavity, leading to high fluorescence intensity. CB[8] cavity volume is large enough (367 Å
3) to encapsulate the BaP molecule comfortably and form a stable inclusion complex with high emission intensity;
Figure 3c. The void space inside CB[8] may still keep some water molecules after the complexation, leading to a less nonpolar environment. Although CB[6] has a small cavity volume, the emission intensity of BaP and FLT increases strongly. CB[6] is typically unable to accommodate a six-membered aromatic ring [
36]. Both PAHs are expected to form external supramolecular interactions with the macrocyclic CB[6], with high fluorescence enhancement [
37]. In this case, the literature has interpreted these spectral properties in terms of the average environment surrounding the fluorophore [
38], the existence of the guests in this new media reduces the degree of freedom of motion of them resulting in fluorescence enhancement, or the host may show surfactant properties [
39]. This could lead to a change in the polarity of the guests’ solution or media.
In aqueous media, FLT shows excitation maxima at a wavelength of 350 nm, and a structureless broad emission peak that extends from 400 to 500 nm, centered on 455 nm (
Figure 4). Significant enhancement of this broad emission band can be observed upon incremental additions of CB[n] aqueous solutions to 1.0 × 10
−6 M FLT solution, as shown in
Figure 5. This denotes an increase in the rigidity of the guest and a decrease in the energy wasted by internal conversion and collision with the solvent due to complex formation [
31]. The increase in intensity became almost constant with increasing CB[6] at concentrations higher than 3.5 × 10
−4 M, indicating an equilibrium state
(Figure 5a) [
40]. The large size of FLT compared to the CB[6] cavity volume possibly gives rise to an external association complex. The behavior of the FLT-CB[7] and FLT-CB[8] complexes are fairly similar, with similar emission enhancement trends;
Figure 5b,c.
The concentration of the non-fluorescent host controls the enhancement of the guest’s fluorescence, according to the modified Bensi–Hilderbrand equation. Whereas
and
represent the fluorescence intensity in the maximum fluorescence intensity of the complex formed and the absence of host, respectively, F is the fluorescence intensity at each tested [host]
0. K
a is an association or binding constant of the complex, it is a measurement of the thermodynamic stability of the host–guest complex at a given temperature in a given solvent [
41]. The enhancement of the fluorescence intensity of the guests as a function of the added hosts fits well, assuming the formation of a 1:1 complex. The results are summarized in
Table 1. A double reciprocal plot of the host concentration vs. 1/
was produced to validate our assumption. (SI)
The variation in K
a values on all complexes reflects the effect of host size on the stability of the complexes. In addition to the host size, the packing coefficient (PC) can provide further explanation for this variation. PC is defined as the ratio of guest volume to the volume of the host cavity. It is considered one of the most important factors determining the stability of the host–guest complex. It works as an estimator of the steric goodness of fit of host–guest inclusion complexes. In general, stable inclusion complexes result when PC values are in the range from 45 to 65% [
33,
42]. Five-membered rings BaP perfectly match and pack the CB[7] cavity, giving a higher and more stable association constant than all of the other hosts. The large cavity of CB[8] allows the optimization of the water H-bond network to a degree that is structurally similar to bulk water, with the result that the energy contribution for water release is less from CB[8] than from CB[7] [
34]. Despite its larger cavity, FLT superbly matches the CB[8] cavity. Surprisingly, the external CB[6]–guest complex is highly stable, too; the host molecules act as a solvent, and the dipole moment of the fluorophore interacts with the reactive fields induced in the surrounding solvent which led to the strength of the resulting complex [
43].
3.2. 1H NMR Spectroscopy
NMR spectroscopy is a powerful tool to study the interactions of the host–guest molecules by providing detailed information on the molecular structure [
44], and it can provide evidence for the inclusion of guests inside the host molecules by the monitoring the alteration of the chemical shift values before and after complexation and by the changes that might affect the shape of the proton signals. The proton’s chemical and the electronic environment of protons are affected by complexation with ensuing changes in the chemical shift values (δ) [
39]. A significant change in the δ of the protons of both guest and host can be observed in the solution of the pure component as compared to the solution of the complex. The resonance signals of the BaP and FLT protons in the
1H NMR spectrum changed with the addition of the three hosts (
Figure 6 and
Figure 7).
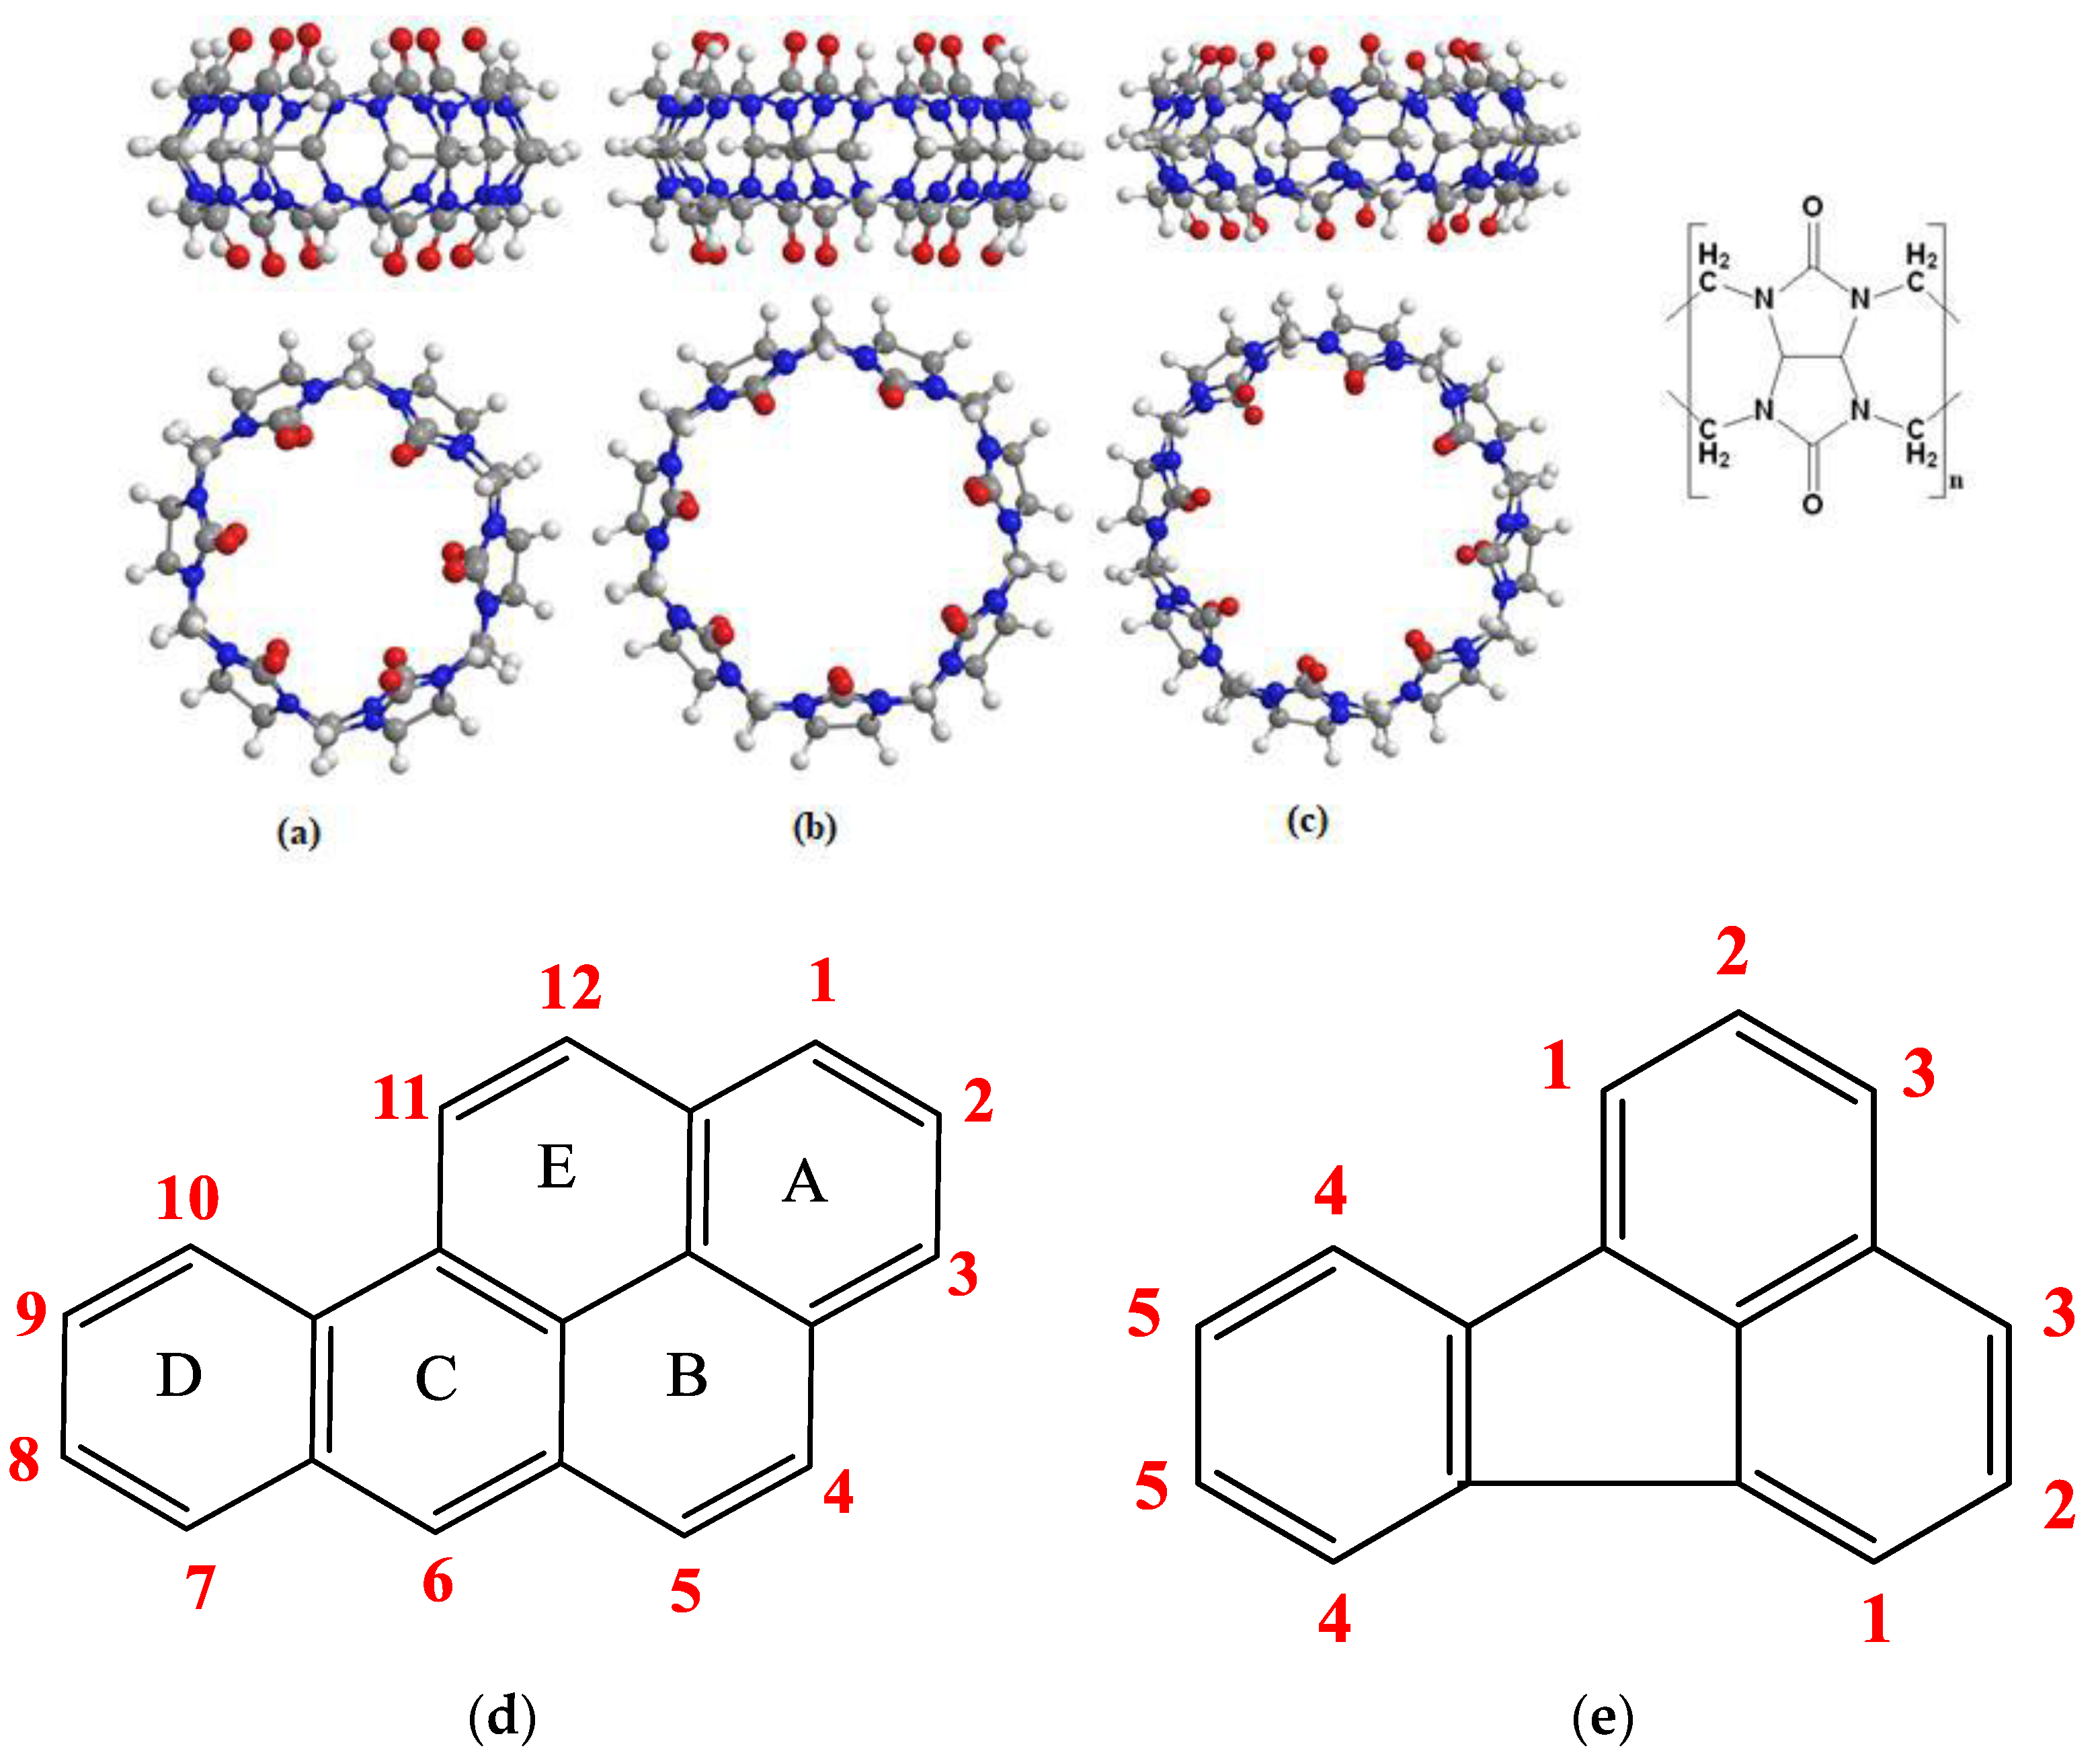
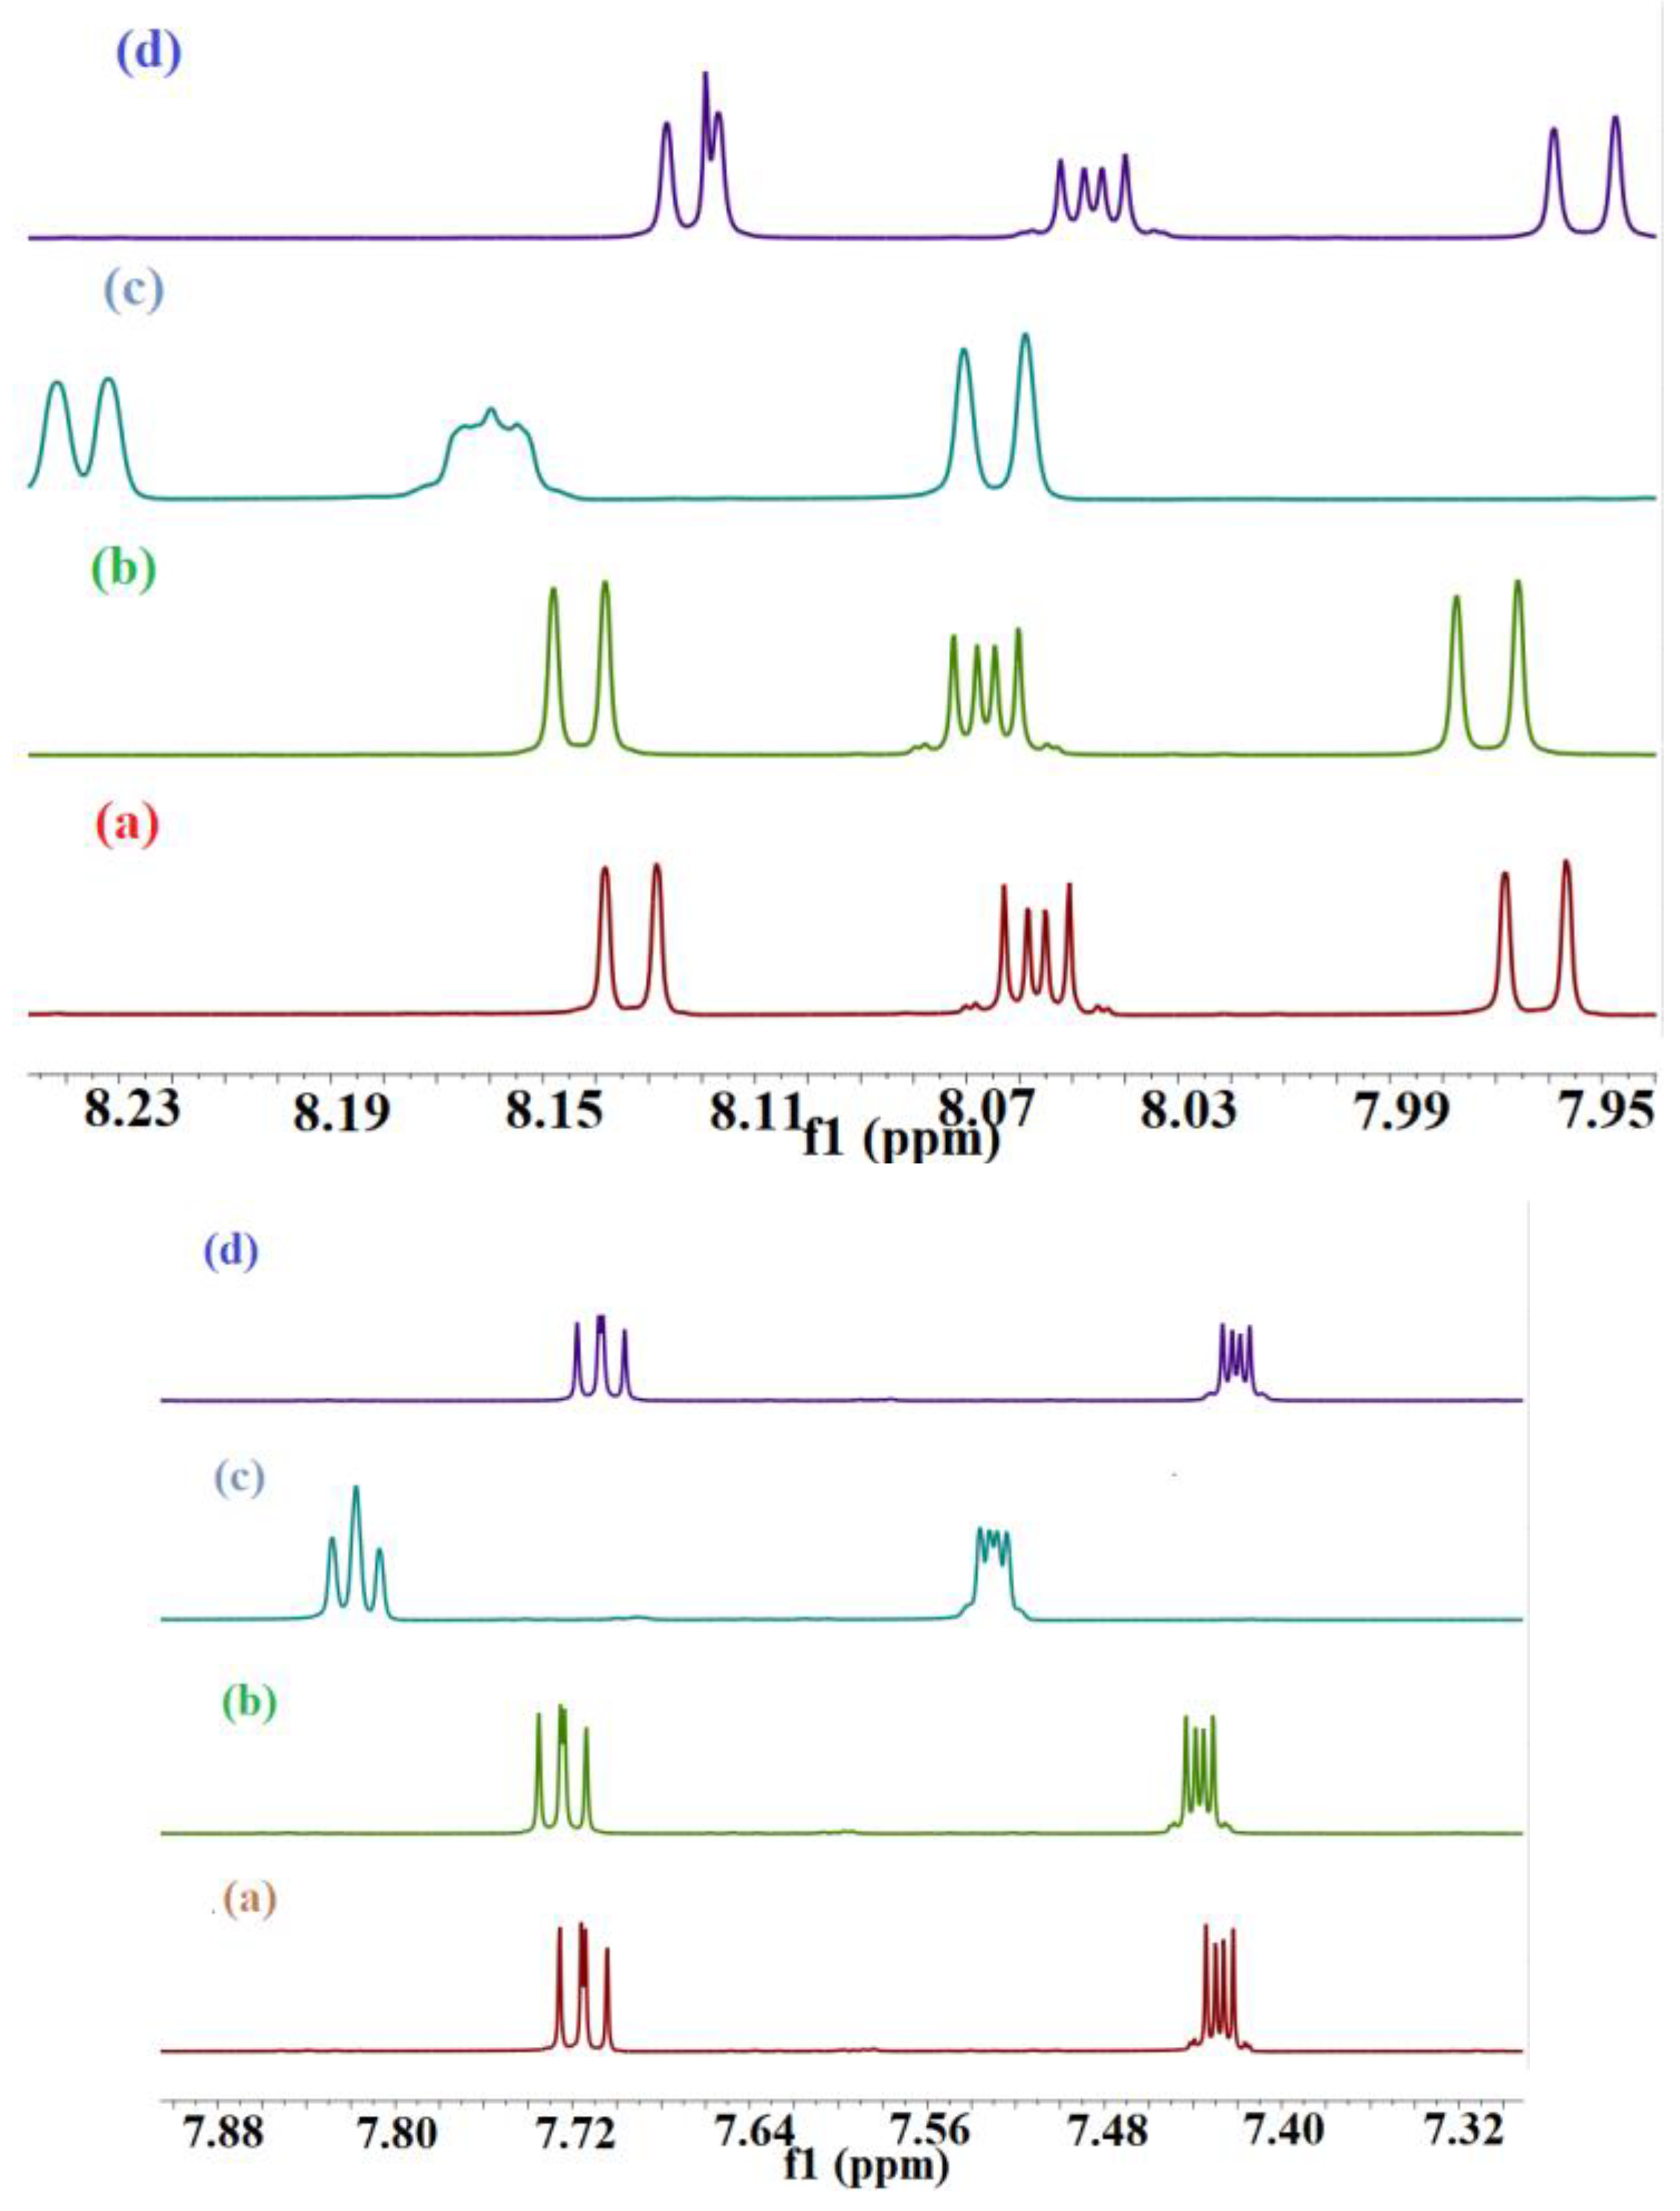
1H NMR of pure BaP exhibit twelve different aromatic protons peaks ranging from 9.253 ppm–7.861 ppm, which are highly deshielded by the large anisotropic field generated by electron cloud in the ring’s π system [
45]. The addition of CB[n] (n = 6–8) into the BaP solution induces spectral shifts suggesting changes in the surrounding electron or magnetic environment (
Figure 6 and
Figure 7). The induced changes in the proton chemical shifts for BaP in the presence of these macrocyclic hosts are summarized in
Table 2 and
Table 3. All BaP protons are shifted upfield upon complexation with CB[8], which means that the interior of the cavity provides magnetic shielding to the protons of the included guest. Nevertheless, CB[6] has a small cavity volume for B[a]P, but all B[a]P protons are shifted upfield in presence of this cavitand. BaP protons in its solution are highly deshielded by the π ring system of the neighboring BaP molecule (BaP exists in excimer form [
30]). Disturbance of this excimer by addition of CB[6] shifted these protons to the lowest deshielding effect, hence, ∆δ < 0 was observed. With regard to CB[7], none of the protons underwent the same chemical shift (up- and downfield), this suggests that the chemical shift changes observed are due to ring current-induced shifts resulting from the reorientation of the rings A and D relative to the ring B, C, and E in the inclusion complex. One interesting finding is that all BaP peaks are sharp and well resolved in the presence of the hosts, reflecting a slower rate of exchange due to the inclusion complexation [
46].
The
1H NMR of pure fluoranthene (FLT) exhibited five different aromatic peaks that were in good agreement with the documented values, ranging from 8.143 ppm to 7.438 ppm, which were shifted upon addition of the three hosts (
Figure 7), giving evidence to support complexation [
47]. It is worth mentioning here that FLT is a non-alternate aromatic hydrocarbon-containing angle strain that has different physicochemical behavior from an alternant one [
48]. CB[8] is the only host that shifted the guest proton signal up-field, as shown in
Figure 7d, hence the interior of the CB[8] cavity provides magnetic shielding to the protons of the included guest. The CB[8] cavity width is slightly too small to allow horizontal encapsulation of FLT, so it is diagonally located with respect to the axis of CB[8] [
34]. Diederich et al. confirms that all protons in the direction perpendicular to the plane of the host are shifted up-field [
49]. All FLT protons are shifted downfield after the addition of CB[6] and CB[7];
Figure 7b,c. This result is indicative of complex formation. The observed downfield shifts of the guest protons can be attributed to the anisotropic effect change in their surrounding environment [
50]. After complexation, the radius of gyration of our guest is small which moves the guest protons more near the deshielding cone of the benzene ring and they will be affected by it more than the cavity hydrophobic shielding effect. The analysis of which specific guest protons are shifted up- or down-field provides important structural information about the nature and the specific mode of the inclusion. The question is: do parts or all the guests reside inside the cavity? And which side of the molecule is inserted into the cavity of the host? The value and sign of ∆δ are summarized in
Table 4 and
Table 5 could provide answers to these questions. All protons of the guest have been shifted with the same sign which is decided by the host used, for instance ∆δ is >0 for the FLT-CB[6]/CB[7] complexes and <0 for the FLT-CB[8] complex. This indicates that they are exposed to the same impact. As mentioned in the literature, the variations in hydrogen chemical shifts are mainly due to the difference in the C-C (π) and the C-C (σ) contributions [
51].
3.3. Molecular Dynamic Simulation
Molecular dynamic (MD) simulation has not been applied for studying the interaction between BaP and FLT with CB[n]. Therefore, it was used here to predict the possibility of formation of BaP and FLT inclusion complexes with these hosts and to investigate their stability. MD provides valuable information pertinent to the fluctuations and conformational changes in atoms and molecules in materials [
52]. The conformer with the lowest energy was obtained by docking the guest into the host’s cavity using the autodock program; then, after geometry optimization using the semispirical calculations, it was used as an input file for MD simulation. The docked structures were located in a box of TIP3P water, and were simulated at 300 K and 1 atm for 30 ns. The simulation event analysis module of the Schrodinger software was used to analyze the resultant trajectories and to calculate the RMSD and the radius of gyration (r
gyr).
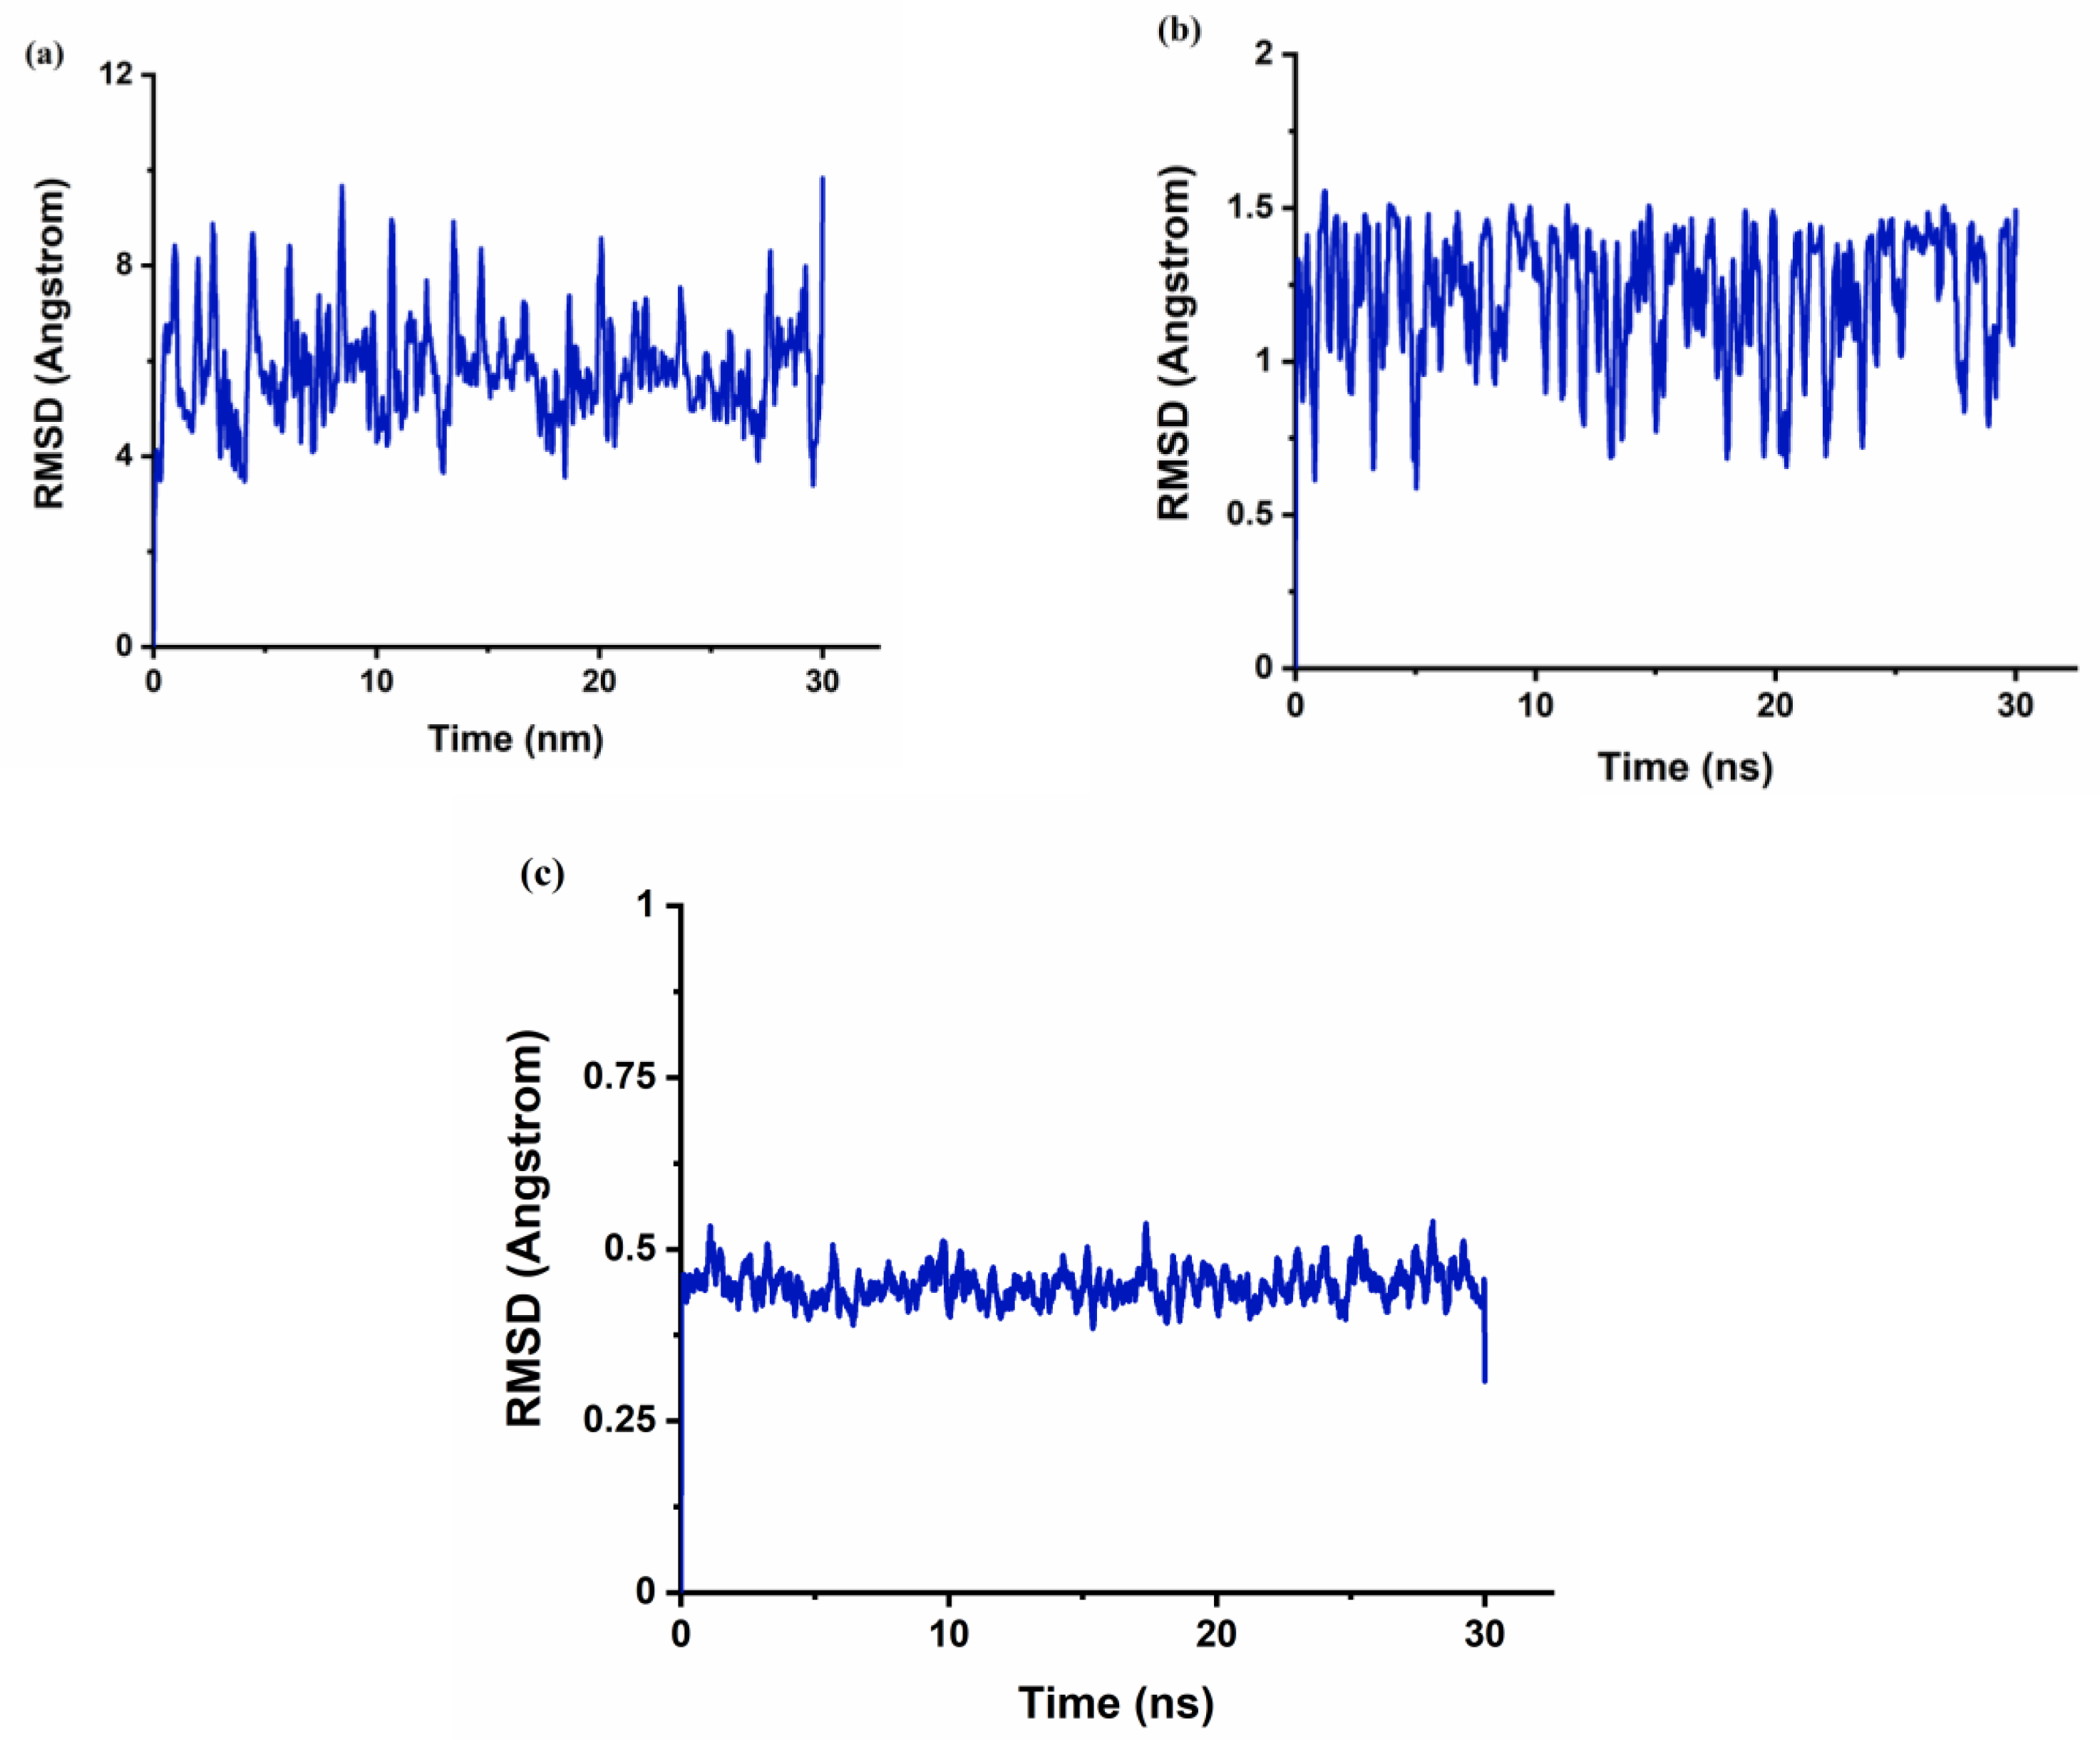
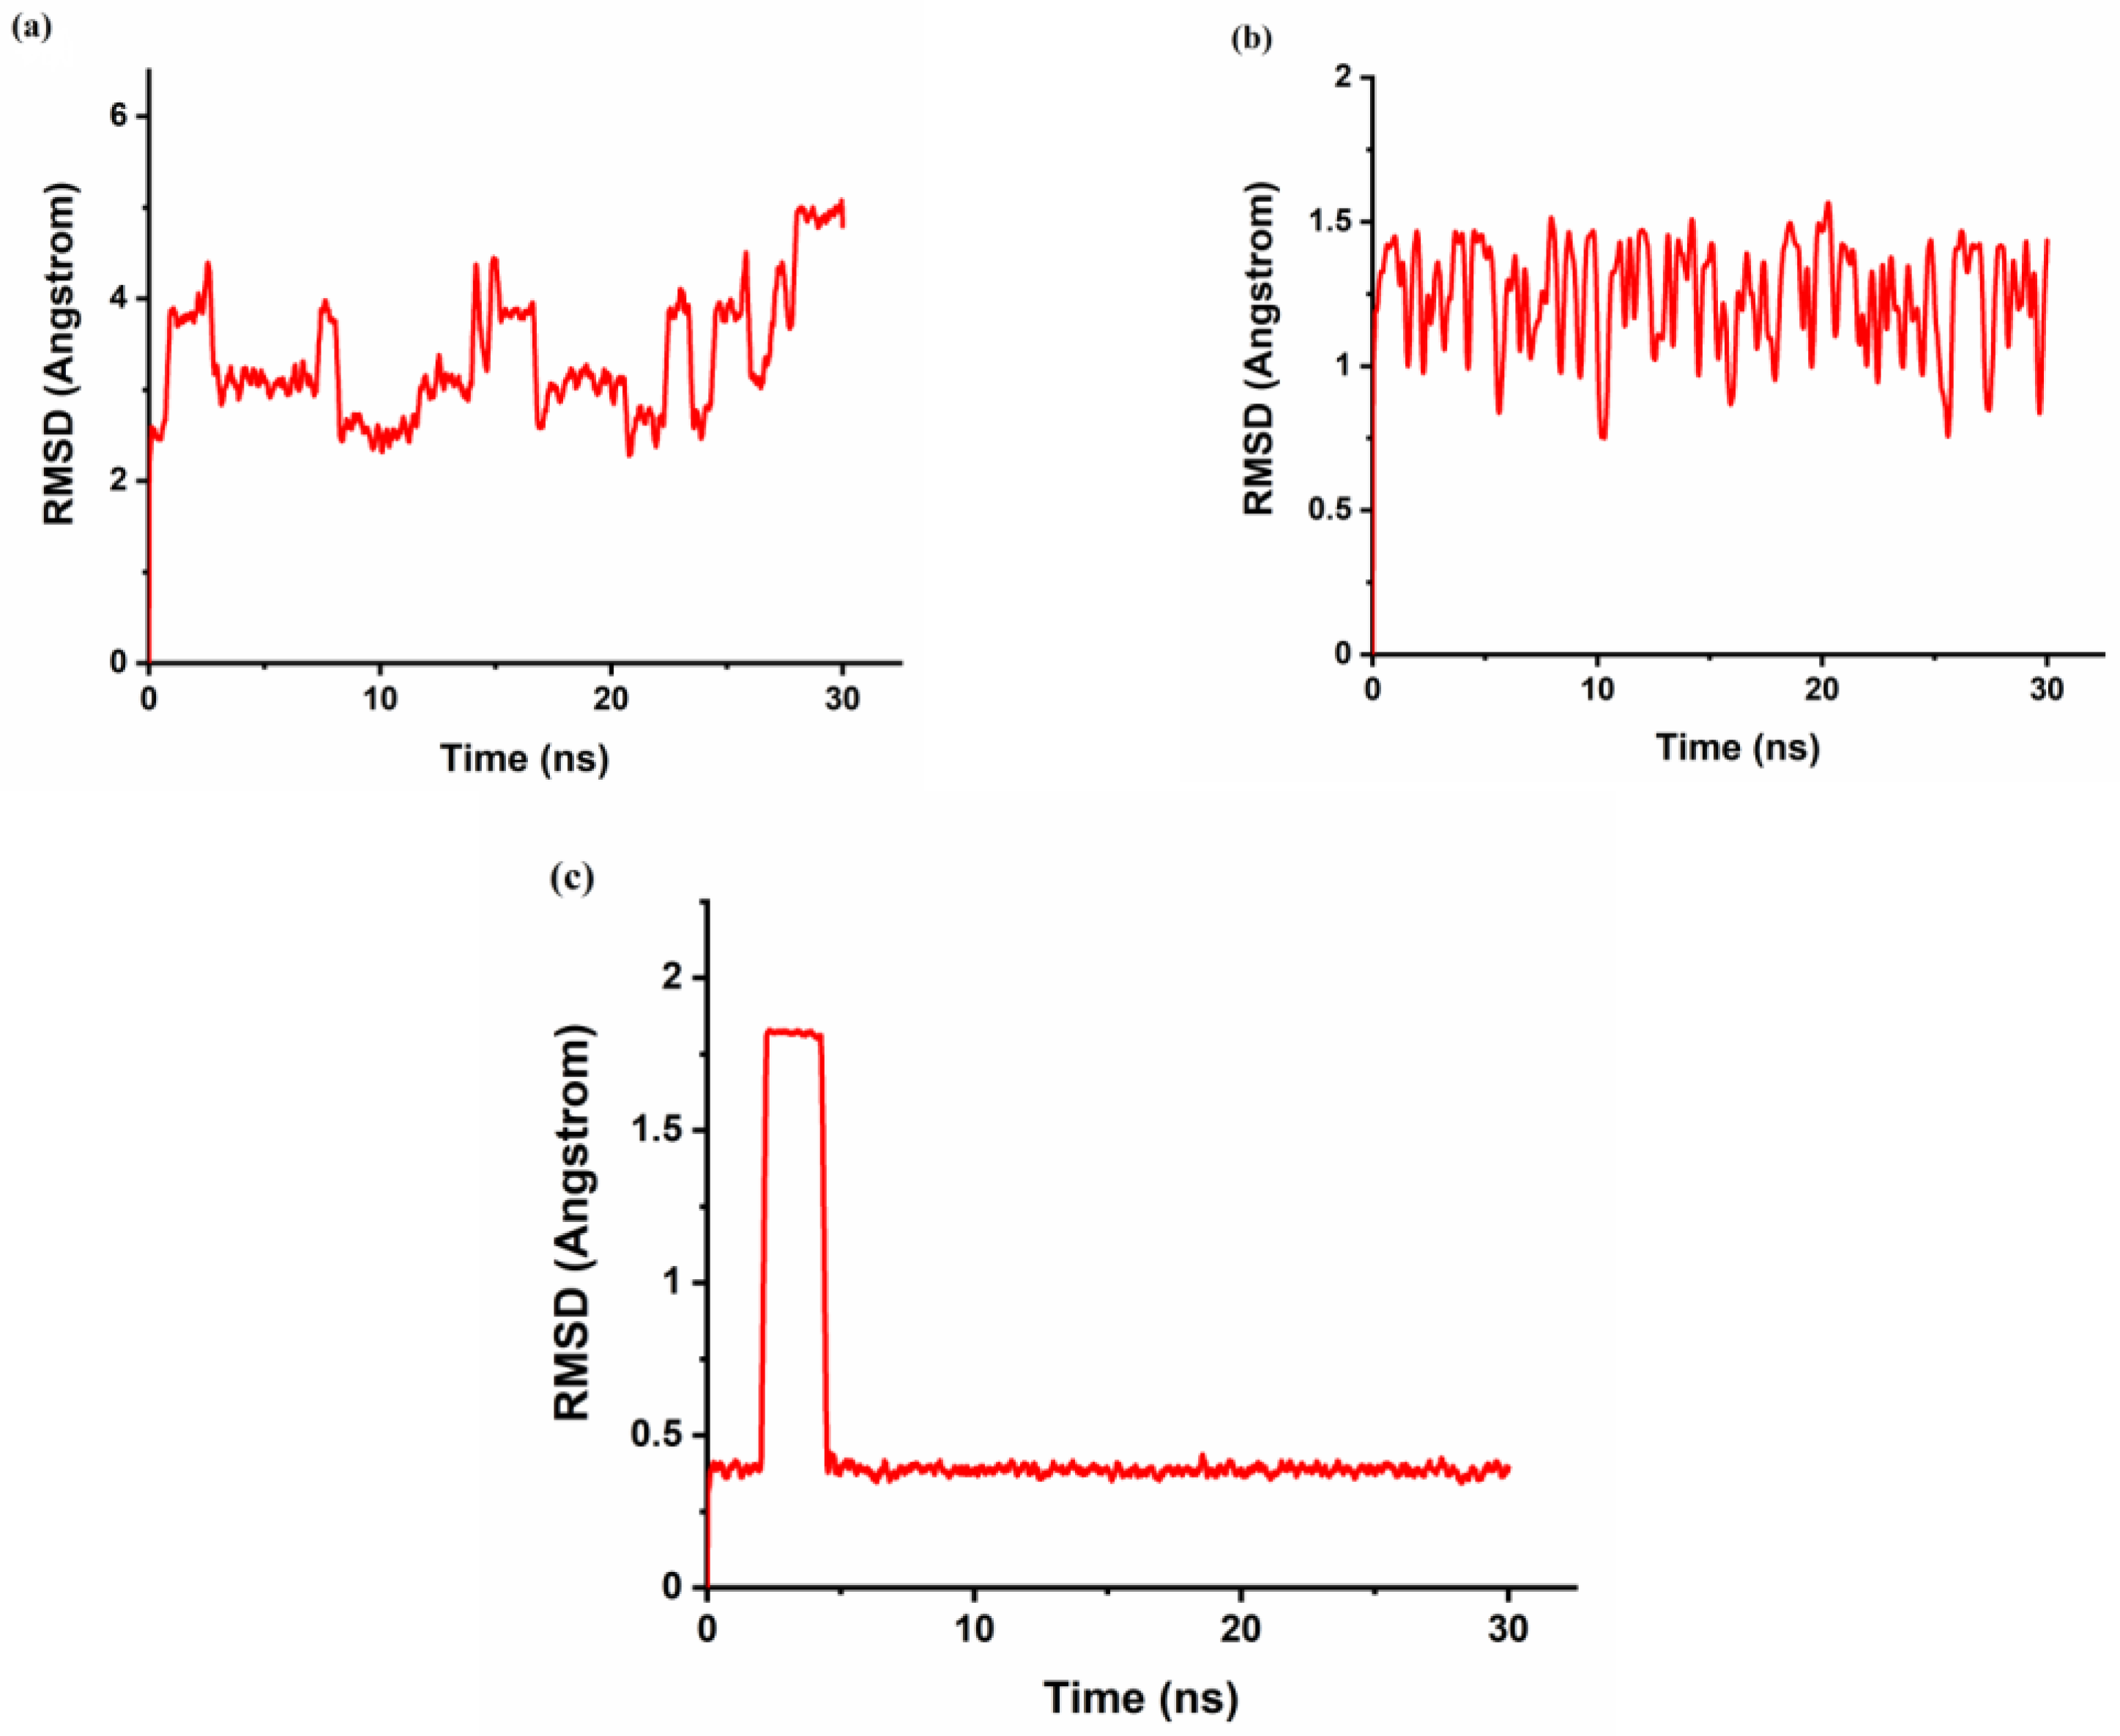
The r
gyr can be used to characterize the typical distance traveled by the body while the RMSD is used as a quantitative measure of the similarity between two or more complexes or molecular structures. BaP and FLT with CB[6] produce unstable trajectories, as is evident from the RMSD plots in
Figure 8a and
Figure 9a. The snapshots that were taken during the simulation time reveal that the guest molecule does not encapsulate inside the CB[6] cavity or even stay at the rim. It has been reported that from the electrostatic potential surface calculations on CBs, the outer surface is somewhat electrostatically positive. This could lead to interaction with the aromatic compounds via π∙∙∙π and/or C–H∙∙∙π interactions which are defined as outer-surface interactions [
53].
The π∙∙∙∙π interaction is between the carbonyl group of CB[n] molecule and the PAH molecules, whereas C–H∙∙∙∙π interactions are between the methylene group on the outer surface of CB[n] molecules with the PAH molecules [
16]. The RMSD results of the BaP-CB[8] complex shows less fluctuations compared to that of the BaP-CB[7] as shown in
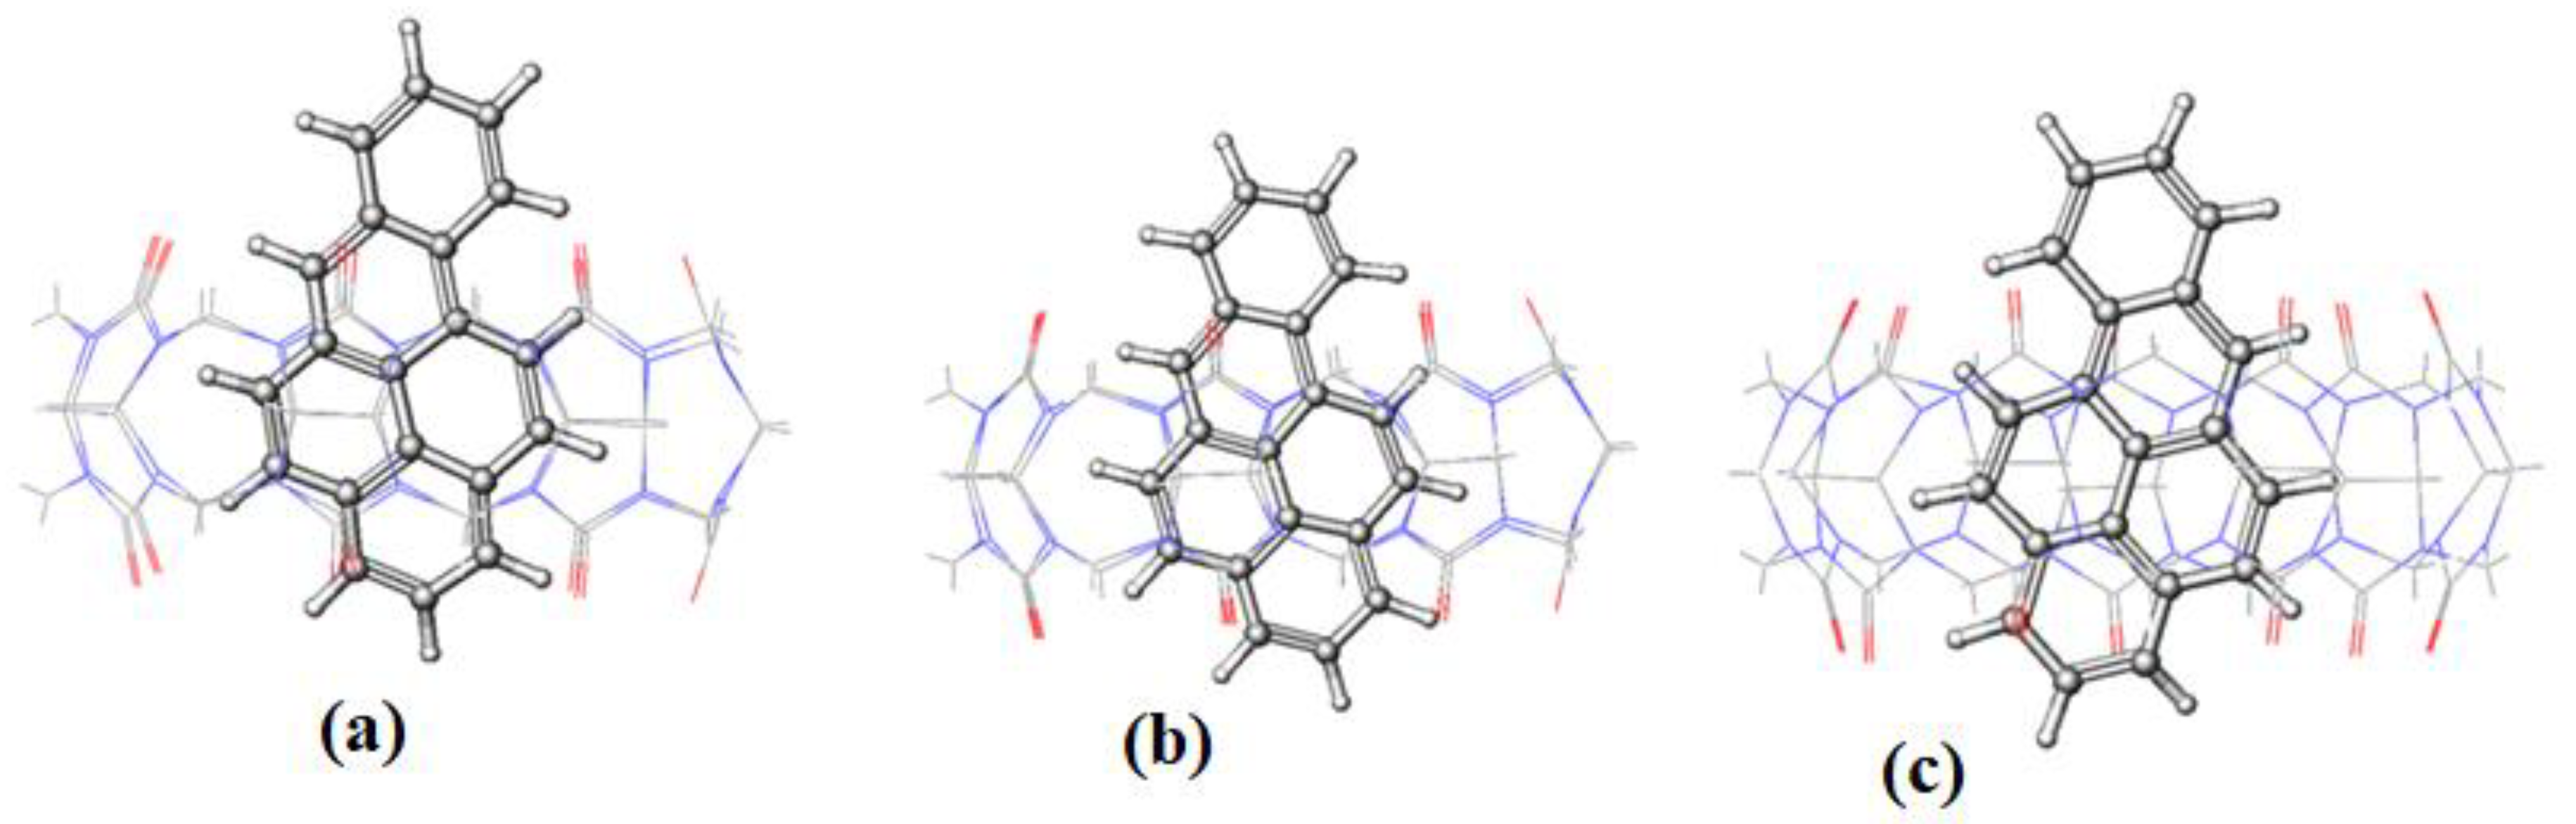
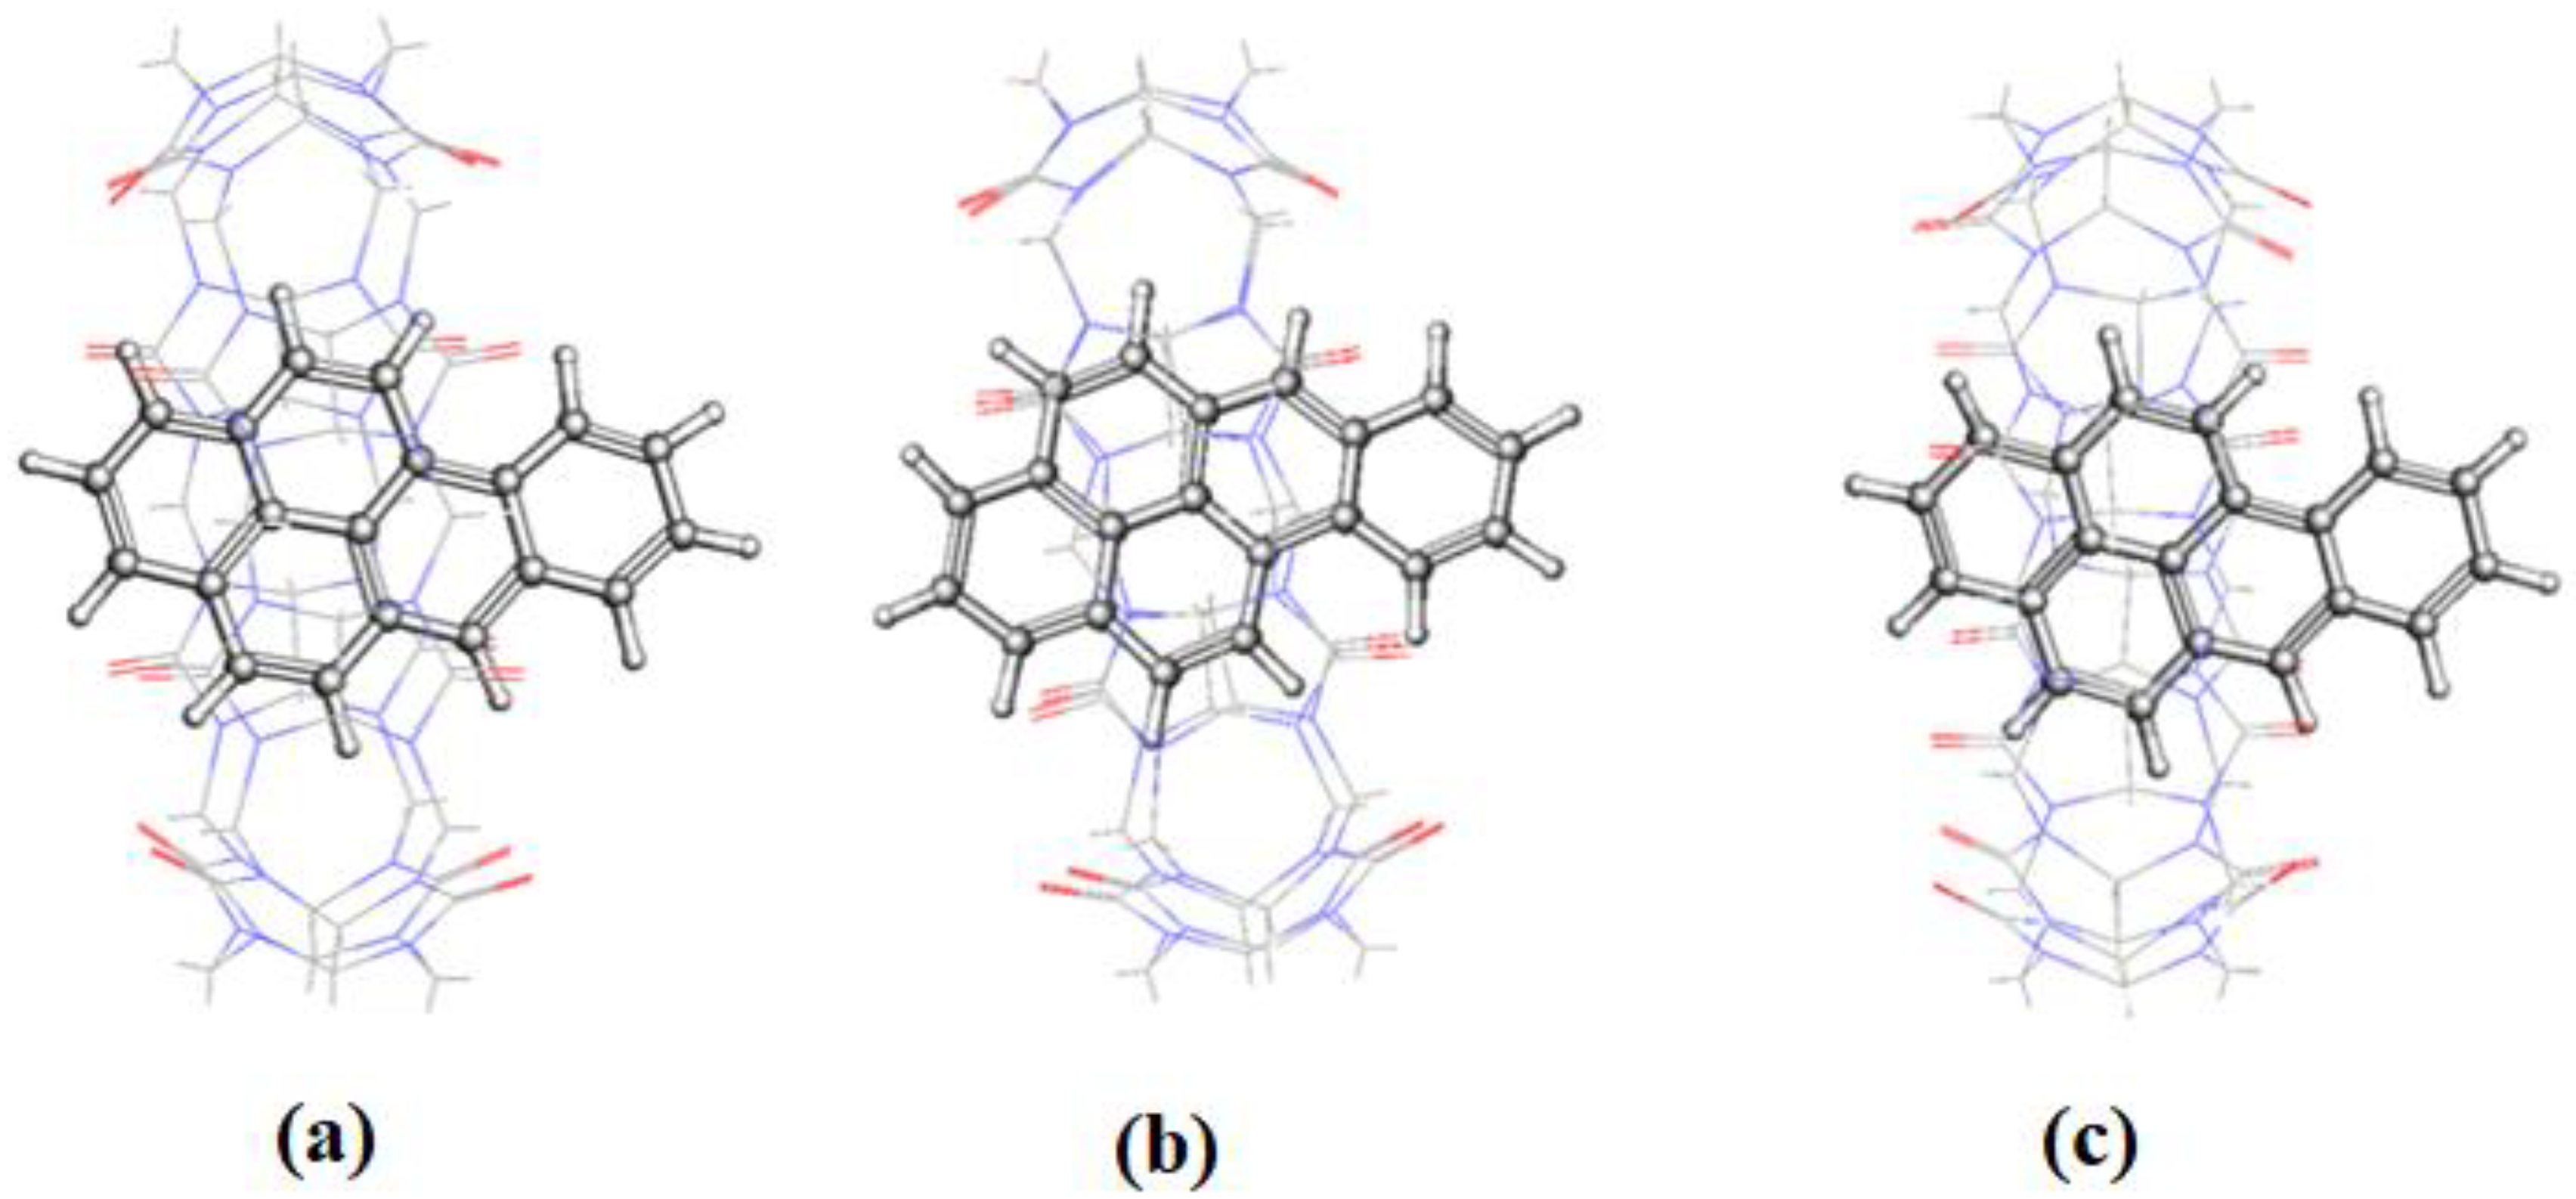
Figure 8b,c. Both complexes reach stability in less than 0.5 ns, and their RMSD values remain constant until the end of the simulation time. There are only minor differences in interactions within these two complexes, which stem mainly from the host cavity size. In both cases, the guest is well inserted into the host cavity, but the encapsulation of the BaP into CB[8] results in a structure more compact compared to BaP insertion into CB[7] as evident by the values of the rgyr. The snapshots illustrated in
Figure 10 and
Figure 11 for BaP-CB[7] and BaP-CB[8] complexes, respectively, show that BaP inserts the pyrene side into the cavity of these hosts.
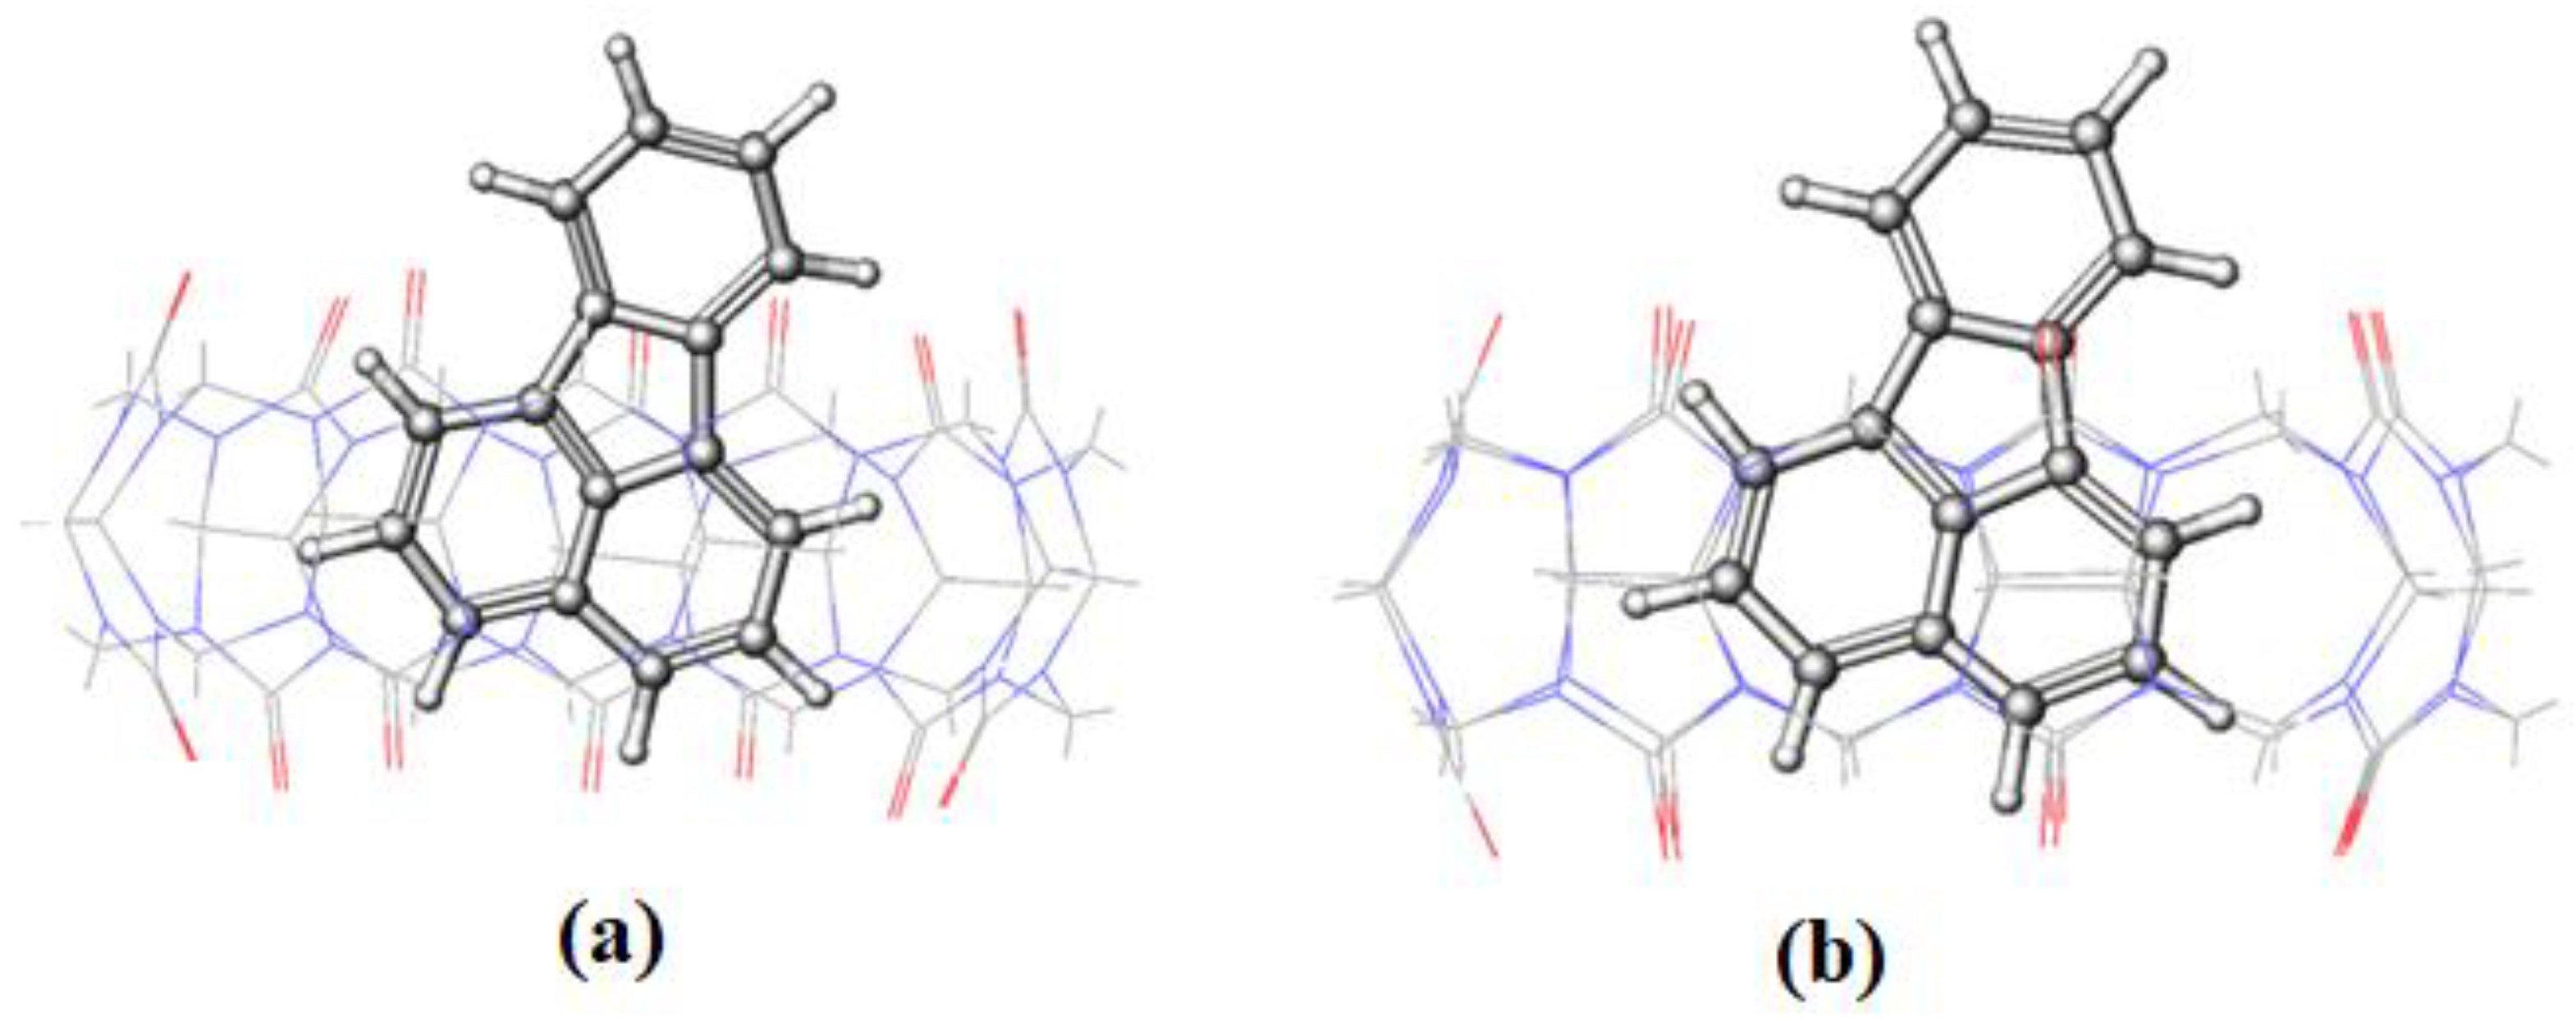
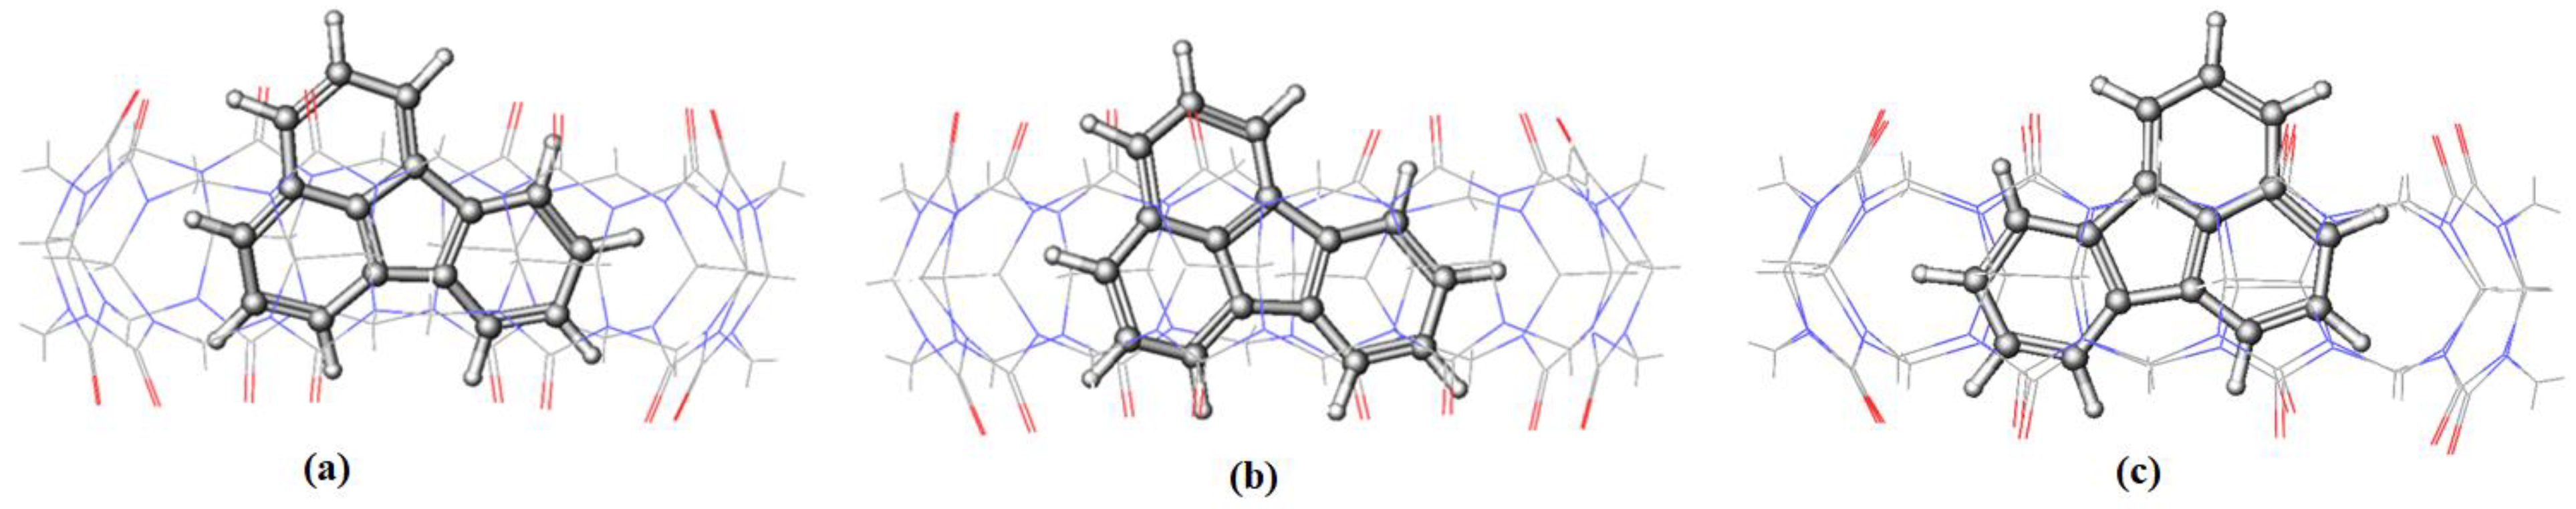
FLT enters the cavity of CB[7] by pushing the fused two benzene rings aside (on the naphthalene side), as shown in
Figure 12. An interesting behavior was encountered for the inclusion of FLT into the CB[8] cavity, as evidenced by the RMSD plot in
Figure 9, with a huge increase in the RMSD value between 2.5 and 4 ns of the simulation time. The snapshot collected at 3 ns (
Figure 13) shows that the complex remains intact with the guest molecule encapsulated inside the cavity of the host. After 4 ns, the inclusion complex of FLT-CB[8] shows a stable trajectory throughout the simulation. It is clear that most of FLT is inside the cavity to maximize the interactions with the host. The large cavity size of CB[8] allows this bulky guest to comfortably fit in it attaining the maximum stability as reflected in the higher binding energy.
The radius of gyration (r
gyr) of the hosts, guests, and their corresponding inclusion complexes during the simulation time are summarized in
Table 6 and
Table 7. The values of the r
gyr of all complexes are comparable to those of the guests and are generally less than the sum of r
gyr of the individual host and guest. This indicates the existence of a compact association between the guest and the host, except in the case of CB[6].

 ,
, 


